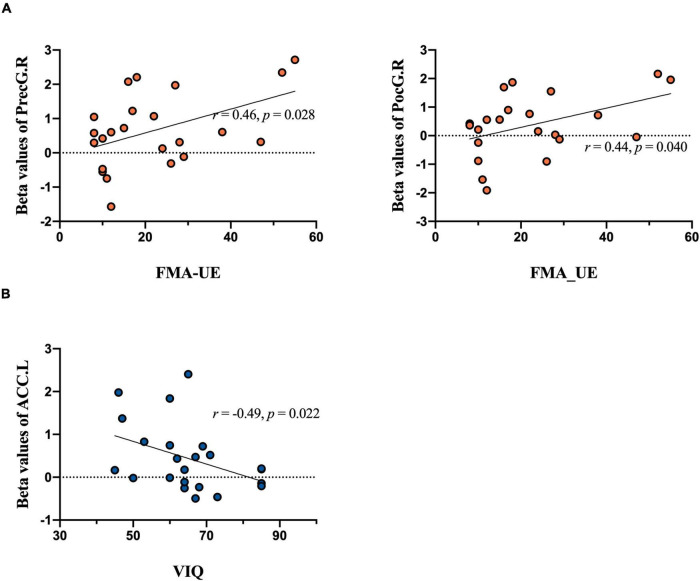
FIGURE 6.
Correlation analysis results. Brain activation during tasks between groups in relation to behavioral performance is included. The upper plane in the figure shows the correlation analysis of extracted beta values from MarsBaR in each region of interest during the motor execution task and the FMA-UE score. (A) Significant positive relationship between PreCG.R and FMA-UE score [left panel, unaffected hand (UH)] and PoCG.R and FMA-UE score [right panel, unaffected hand (UH)]. The lower plane in the figure shows the correlation analysis of imagery task-related activity and the VIQ score. (B) Significant negative relationship between ACC.L and VIQ score [unaffected hand (UH)].

