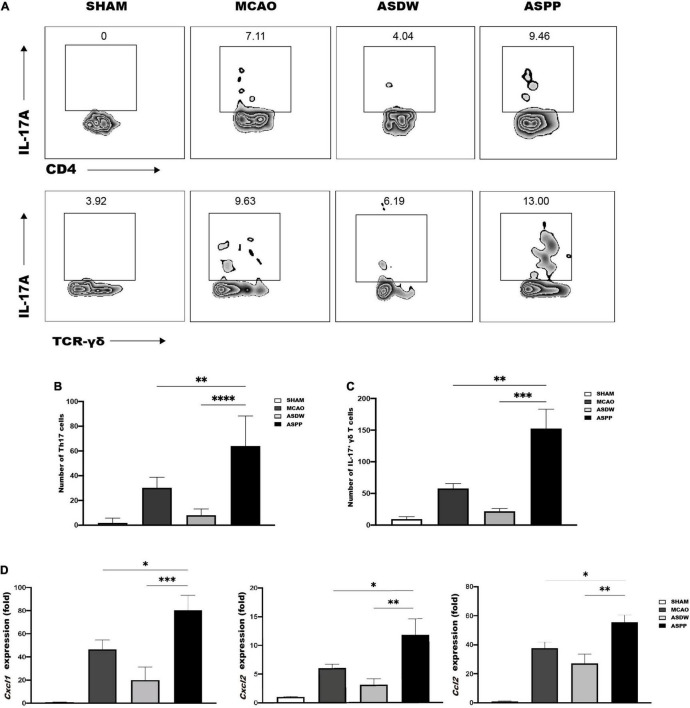
FIGURE 3.
More Th17 and IL-17+ γδ T cells accumulate in the ischemic brain of ASPP group. (A) Representative flow cytometry analysis of Th17 cells and IL-17+ γδ T cells in the ischemic brain. (B) Quantification of Th17 cells. n = 4:4:4:4. (C) Quantification of IL-17+ γδ T cells. n = 5:5:5:5. (D) qPCR analysis of relative mRNA expression of Cxcl1, Cxcl2, and Ccl2 in the ischemic brain. n = 7:10:8:10. Values represent mean ± SD. One-Way ANOVA was used for statistical analysis. *p < 0.05, **p < 0.01, ***p < 0.001, ****p < 0.0001.

