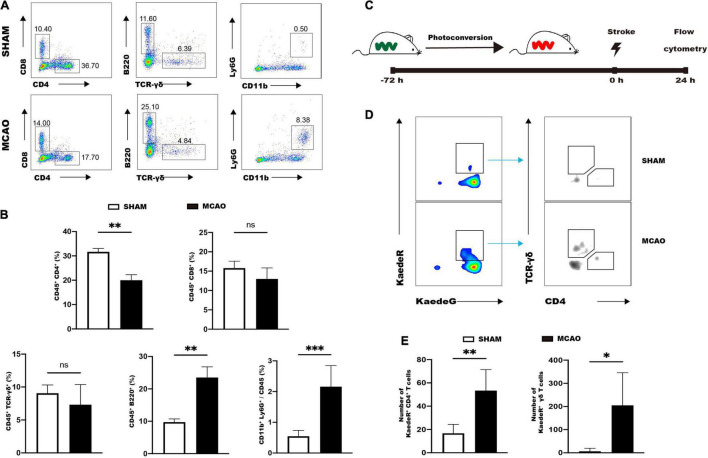
FIGURE 5.
Intestinal immune cells rapidly respond to ischemic stroke. (A) Representative flow cytometry analysis of immune cells in the small intestine 1d after MCAO or sham operation. (B) Quantifications of immune cells in the small intestine. n = 5:5. (C) Strategy for analyzing intestinal immune cell trafficking to the brain by using Kaede transgenic mice. (D) Representative flow cytometry analysis of photoconverted CD4+ T cells and γδ T cells in the ischemic brain. (E) Quantifications of photoconverted CD4+ T cells and γδ T cells. n = 4:6. Values represent mean ± SD. Student’s t-test was used for statistical analysis. ns, not significant; *p < 0.05 **p < 0.01, ***p < 0.001.

