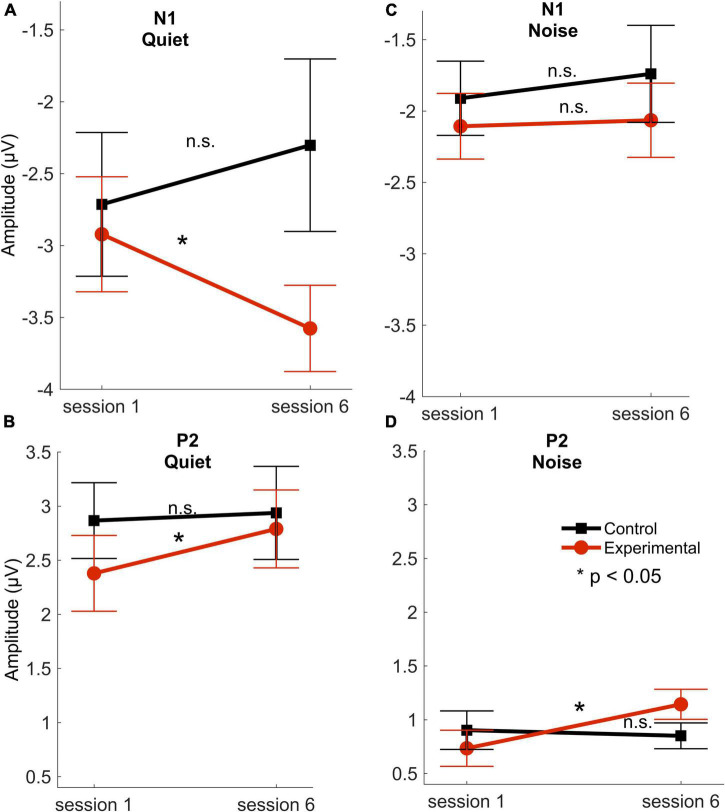
FIGURE 3.
Response amplitudes. N1 and P2 mean amplitudes for the experimental (red circles) and control (black squares) groups across sessions 1 (first) and 6 (last) in quiet (A,B) and noise (C,D) conditions. Error bars represent standard error of the mean. *P < 0.05. n.s, not significant. There were no significant differences between the control and experimental groups in session 1 in any of the cortical amplitudes in quiet [N1: t(29) = 0.665, p = 0.511; P2: t(29) = 1.331, p = 0.194] or in noise [N1: t(29) = 0.597, p = 0.555; P2: t(29) = 0.505, p = 0.617] (modified with permission from Karawani et al., 2018a).

