
Fig. 1 |. Trf2−/− ES cells are viable and do not exhibit end-to-end chromosome fusions.
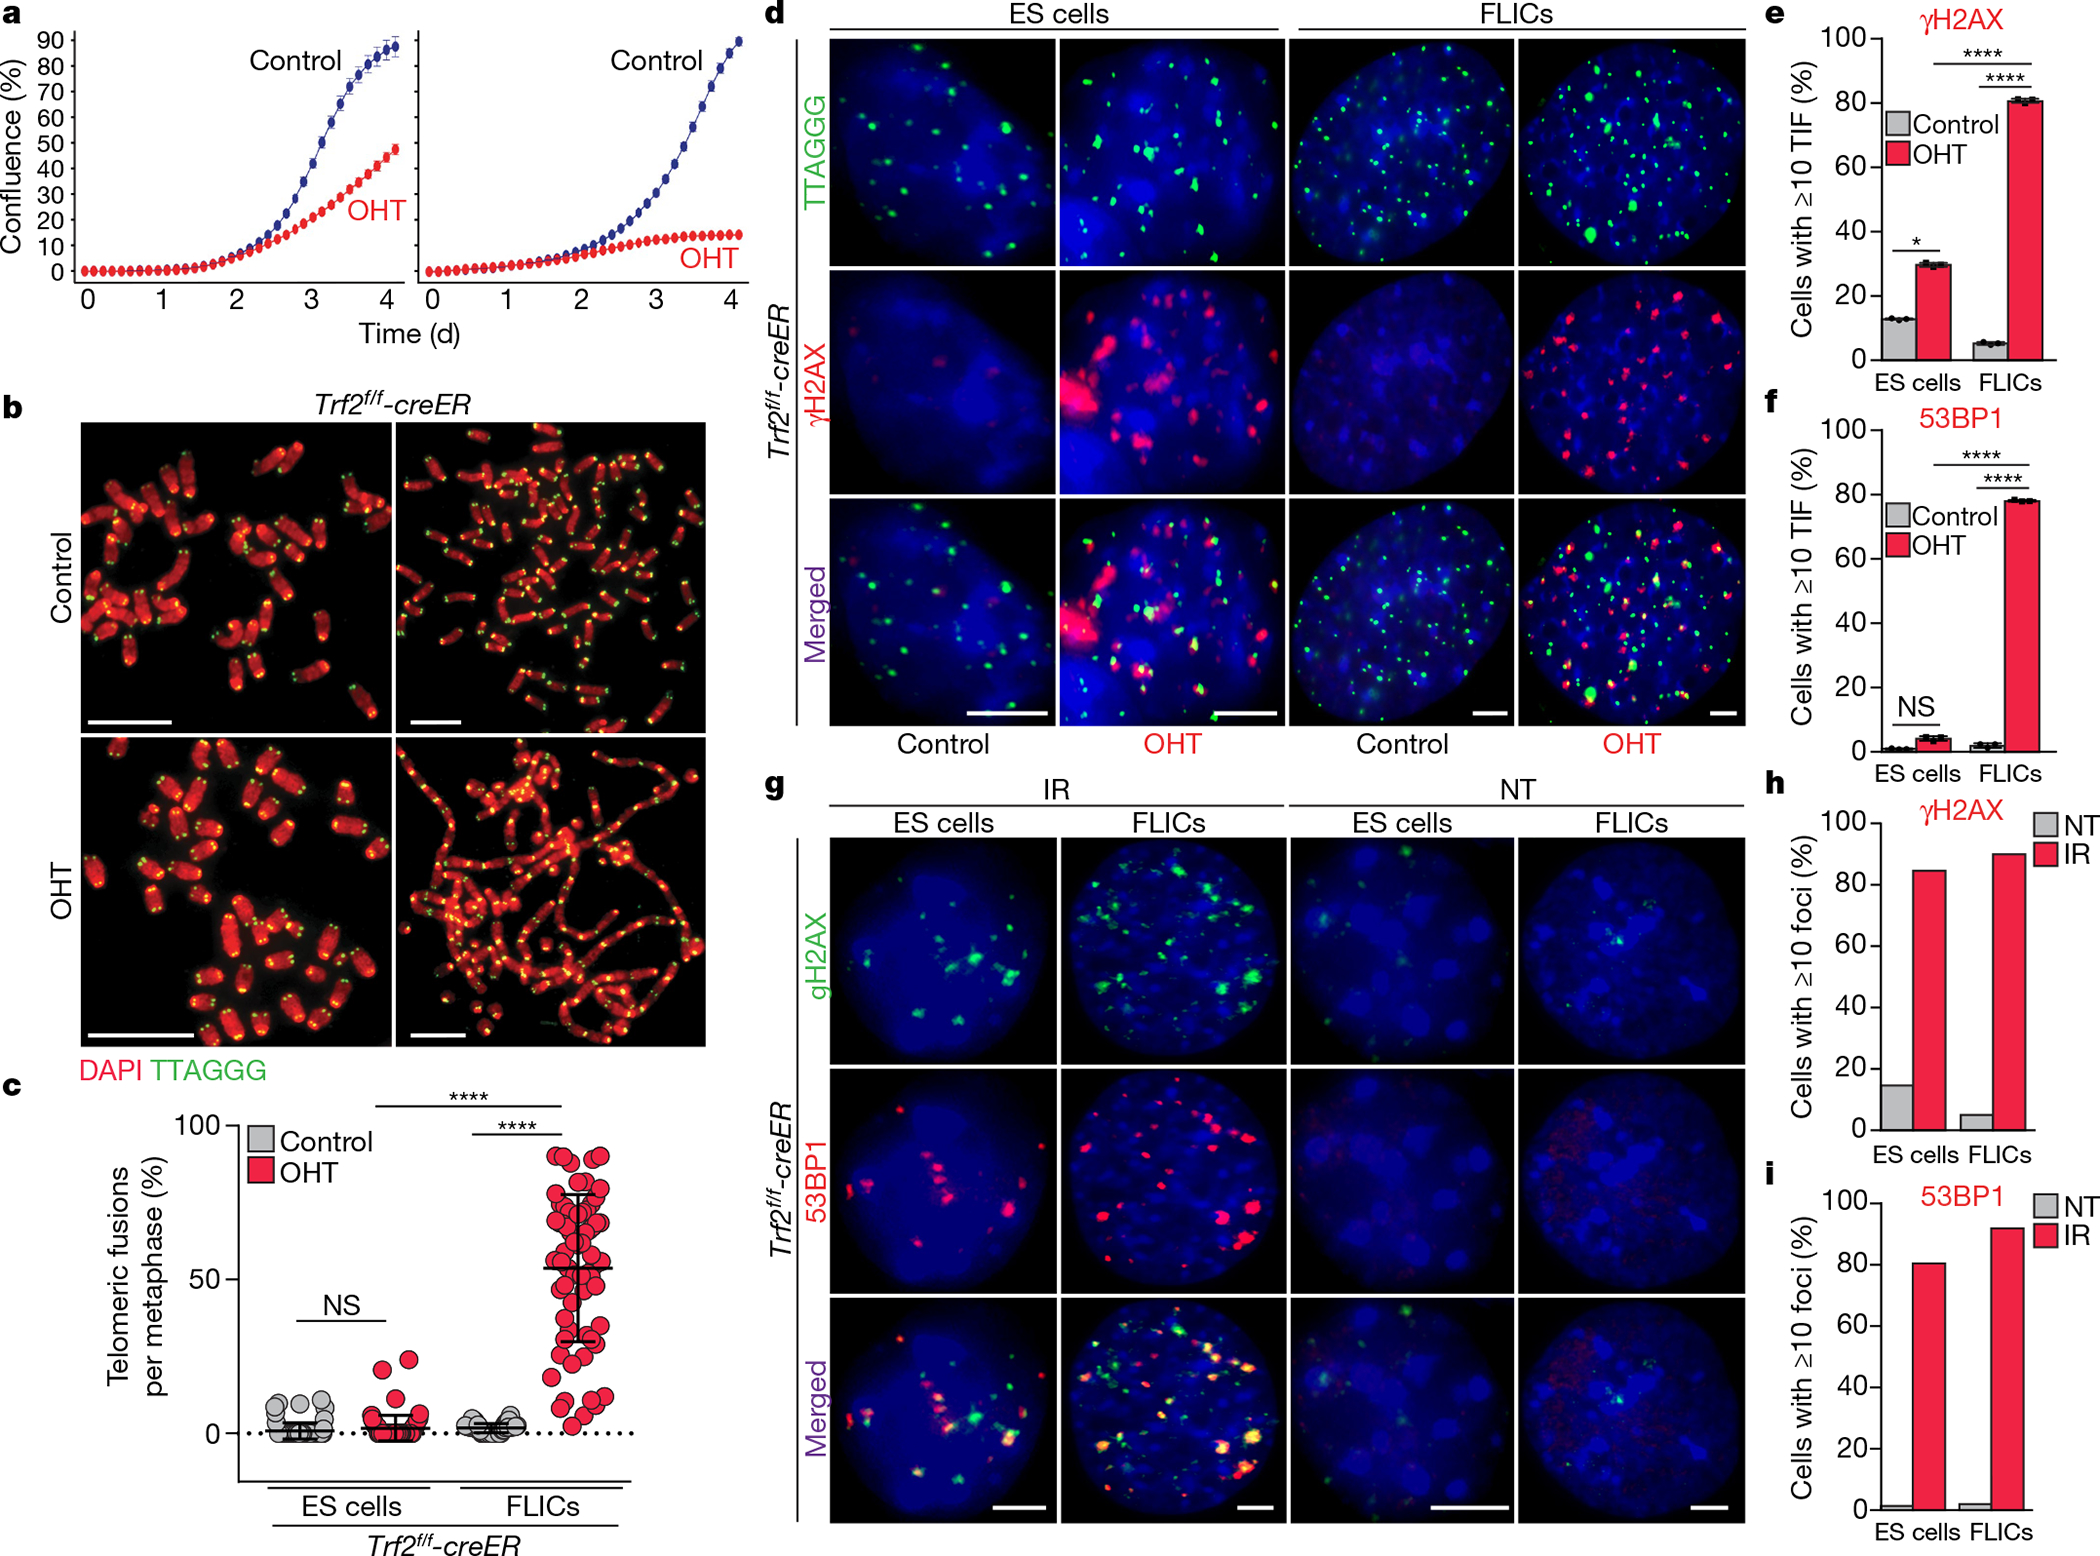
a, Growth of Trf2f/f ES cells (left) and FLICs (right) before (control) or after Cre induction (OHT). Mean and s.d. are derived from the analysis of 25 images per condition. b, Metaphases derived from TRF2-proficient (control) or TRF2-deficient (OHT) ES cells (left panels) and FLICs (right panels). Scale bars, 10 μm. c, Scatter plot representing the distribution of telomeric fusions. Each dot represents the percentage of telomeres fused in one metaphase spread; for detailed information, see Supplementary Table 1, Source Data for Fig. 1 (n = 3 independent experiments). d, Representative immunofluorescence and fluorescence in situ hybridization (IF–FISH) for γH2AX (red) and telomeres (green) in Trf2f/f ES cells and FLICs treated as indicated. Scale bar, 4 μm. e, f, Quantification of the percentage of cells with more than 10 γH2AX (e) or 53BP1 (f) foci colocalizing with telomeres, detected as in d. Representative images of IF–FISH for 53BP1 are reported in Extended Data Fig. 2e. TIF, telomere- dysfunction-induced foci. g, Representative immunofluorescence images for 53BP1 (red) and γH2AX (green) in ES cells and FLICs before (not treated (NT)) or after irradiation (IR) (2.5 Gy). Scale bar, 4 μm. h, i, Percentages of cells with more than 10 γH2AX (h) or 53BP1 (i) foci are shown. In all panels, mean is indicated with centre bars and s.d. with error bars. NS, non-significant (P ≥ 0.05), *P < 0.05, ****P < 0.0001, one-way analysis of variance (ANOVA).