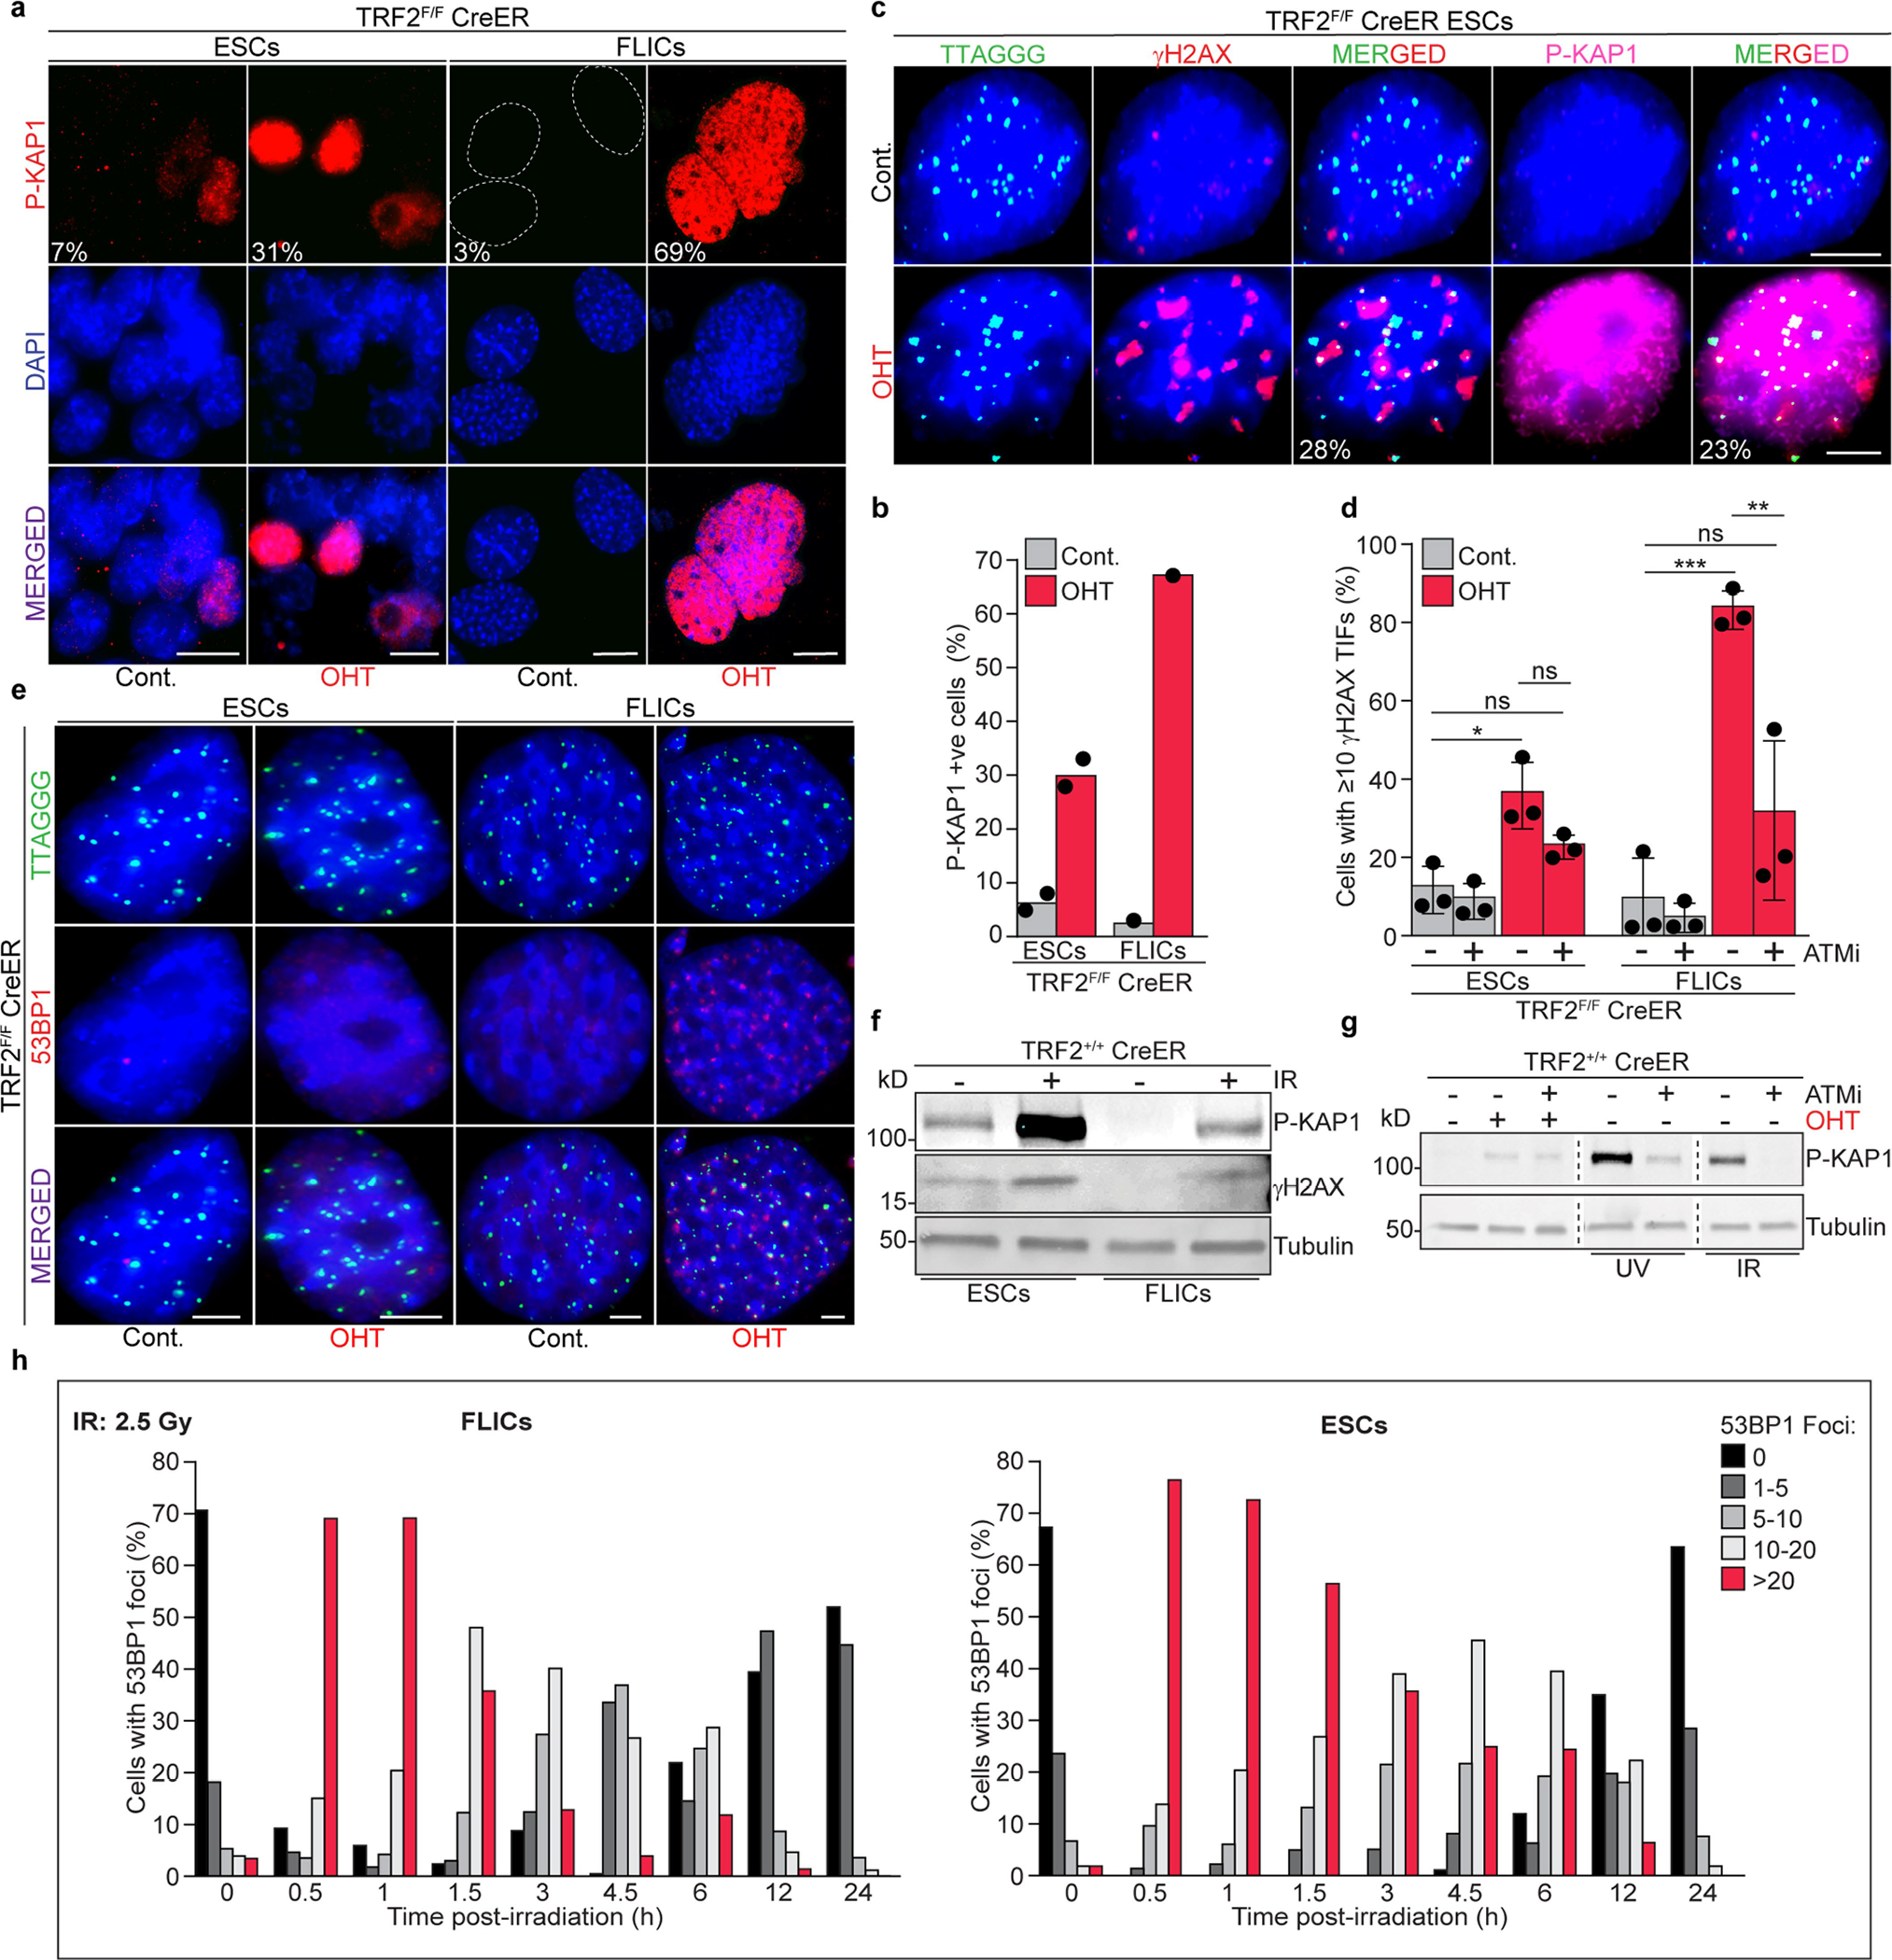
Extended Data Fig. 2 |. Reduced activation of DDR in ES cells following telomere deprotection.

a, Representative immunofluorescence for KAP1 phosphorylated at S824 (p-KAP1) in ES cells and FLICs either before (cont.) or after Cre induction (OHT). Scale bar, 10 μm. Percentages of p-KAP1-positive cells are indicated in the figure as well as in b. The experiment was performed twice for ES cells with similar results and once for FLICs. c, Representative immunofluorescence staining for γH2AX (red), p-KAP1 (pink) and FISH staining for telomeric DNA (green) of TRF2-proficient (cont.) and TRF2-deficient (OHT) ES cells. Percentage of TIF-positive cells (third panel from left) and percentage of cells with TIF and positive for p-KAP1 (last panel from left) are shown. Scale bar, 4 μm. d, Percentage of ES cells and FLICs with more than 10 γH2AX TIF. Where indicated, TRF2-proficient (cont.) or TRF2-deficient (OHT) cells were treated with an ATM inhibitor. Data panels in the figure are representative of three experiments. ns, non-significant (P ≥ 0.05), *P < 0.05, **P < 0.01, ***P < 0.001, one-way ANOVA. e, 53BP1 (red) localization at telomeric DNA (green) in TRF2-proficient (cont.) and TRF2-deficient (OHT) ES cells and FLICs. Quantification of these data are reported in Fig. 1f. Scale bar, 4 μm. f, Western blotting analysis for p-KAP1, γH2AX and—as a loading control—tubulin. Protein lysates were isolated from ES cells or FLICs either mock-treated or gamma irradiated (2.5 Gy) 30 min before collection. g, Western blotting analysis for the expression of p-KAP1 or—as loading control—tubulin. Protein lysates were derived from ES cells that were either untreated or treated with the ATM inhibitor, as indicated. Where indicated, cells were treated with OHT to induce TRF2 depletion, with UV (1,200 J per m2) or with gamma irradiation (2.5 Gy). h, Dissipation of 53BP1 DNA damage foci following IR-induced damage in FLICs (left) and ES cells (right). Cells were treated with gamma irradiation (2.5 Gy) and fixed at the indicated time points. 0, non-treated control samples. For each time point, at least 140 nuclei were scored and the percentage of cells with the indicated number of 53BP1 foci at any given time point is indicated; additional details can be found in Supplementary Table 2.
