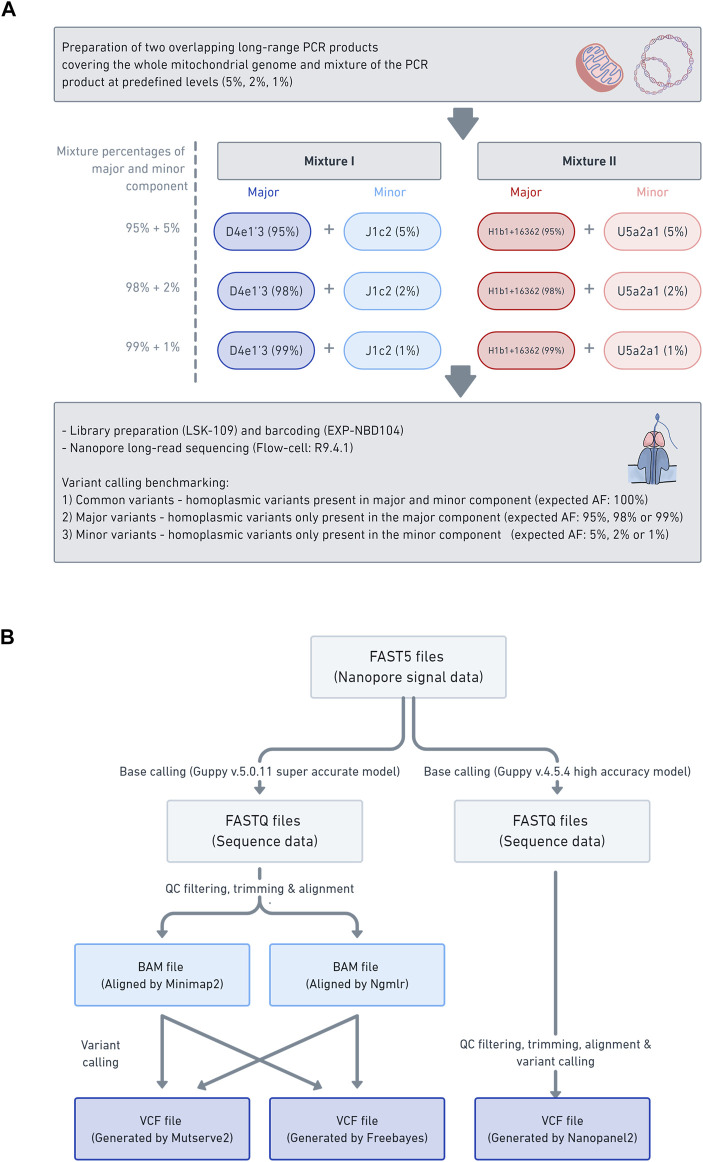
FIGURE 1.
Laboratory workflow data analysis pipeline (A) The schema illustrates the laboratory workflow for the preparation of the mitochondrial DNA (mtDNA) mixture models and subsequent nanopore sequencing (B) Workflow of how the mtDNA nanopore data was processed and which aligners (i.e., Minimap2 and Ngmlr) and variant callers (i.e., Mutserve2, Freebayes, and Nanopanel2) were used.

