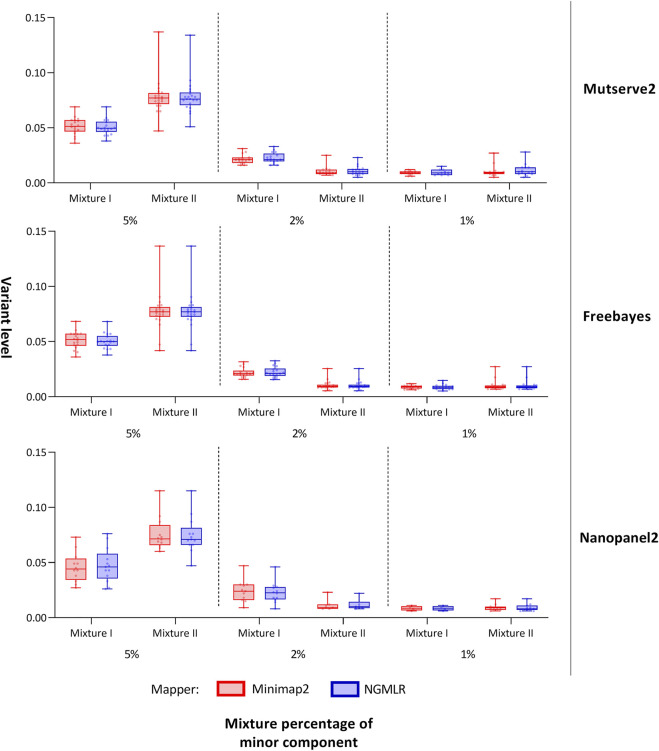
FIGURE 3.
Allele frequency of variants detected from the mitochondrial DNA nanopore data. Box plots show the allele frequency of the mitochondrial minor variants detected with two aligners (i.e., Minimap2 and Ngmlr) and the three variant callers (i.e., Mutserve2, Freebayes, and Nanopanel2). The bars and whiskers represent the median, the interquartile range, and the minimum and maximum.

