FIGURE 1.
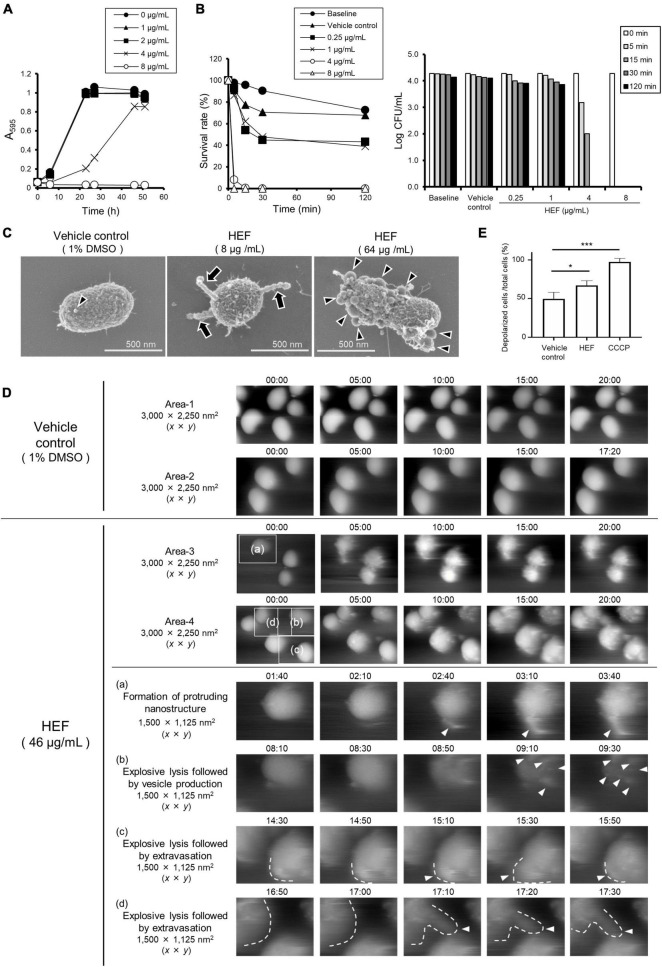
Growth, survival, and morphology of P. gingivalis after treatment with HEF. (A) Growth curves of P. gingivalis in the presence or absence of HEF. The bacterial cells standardized at a concentration of 1 × 10⁸ CFU/mL were treated with HEF at various concentrations. Transition of turbidity (A595) of the bacterial culture was monitored at different time points for 2 days. Data shown are representative of three independent experiments performed in triplicate, in which similar results were obtained. Average A595 values are plotted in the graph. (B) Killing assay to assess bactericidal activity of HEF against P. gingivalis. Bacterial cells standardized at a concentration of 1 × 10⁴ CFU/mL were treated without or with HEF at various concentrations for 5, 15, 30, and 120 min. P. gingivalis survival rate was evaluated by counting CFU on blood agar plates. For the left graph, data shown were calculated as follows: (CFU at each time point after treatment with HEF/CFU at 0 min) × 100 (%). For the right graph, the y-axis shows Log CFU value. Baseline indicates without treatment. Vehicle control indicates treatment with 1% DMSO as a solvent. Note that the bacterial concentration was lower than that used in the growth assay in (A). (C) Cell morphology observed by FE-SEM. Bacterial cells standardized at a concentration of 1 × 10⁸ CFU/mL were treated with HEF at 8 or 64 μg/mL for 30 min. Representative images are shown. Morphological changes are indicated by arrows for chain-like extrusions and arrowheads for OMVs. (D) Surface dynamics of P. gingivalis cells. Shown are HS-AFM image compilations of P. gingivalis following HEF treatment at a concentration of 46 μg/mL. Two randomly chosen areas sized 3,000 × 2,250 (x × y) nm2 treated with the vehicle control (Areas-1 and -2) or HEF (Areas-3 and -4) are shown. Images of same the area were compiled from 00:00 to 20:00. Insets denoted by (a–d) in Areas -3 and -4 of the main panels obtained at 0 min were selected, then additional images at selected time points are shown below, with higher magnification as (a–d), respectively. These areas were 1,500 × 1,125 (x × y) nm2. Vesicles, chain-like structures, and extravasation are denoted by white arrowheads. Cell shapes in some pictures were traced by white dotted lines. Time points after HEF treatment are indicated on the images in the format of “min:sec.” (E) Membrane potential (ΔΨ) analysis. E. coli cells were treated with HEF at a concentration of 16 μg/mL for flow cytometry analysis. Cells were also subjected to CCCP treatment as controls of depolarized cells. Data shown in the bar graph are the mean ± SD of three independent experiments. The y-axis shows the relative percentage of numbers of depolarized cells to total cells. *p ≤ 0.05. ***p ≤ 0.001. Statistical analysis was performed using ANOVA and Tukey’s multiple comparison test.

