FIGURE 4.
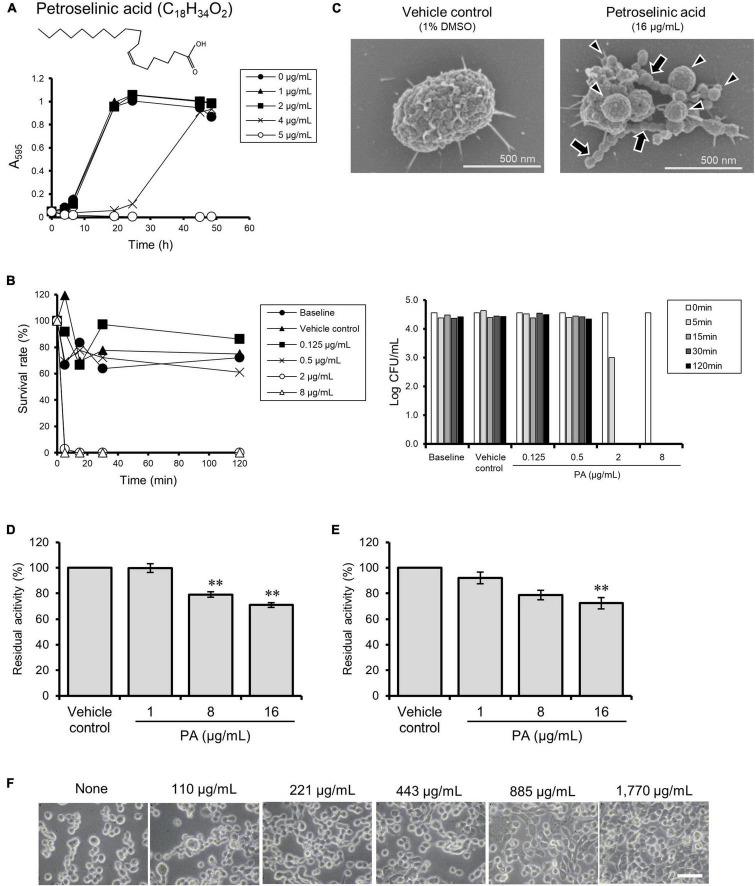
Effects of petroselinic acid (PA) on P. gingivalis. (A) Growth curves of P. gingivalis in presence or absence of PA. Bacterial cells standardized at a concentration of 1 × 10⁸ CFU/mL were treated with PA at various concentrations. Transition of turbidity (A595) of the bacterial culture was monitored for 2 days at different time points. Data shown are representative of three independent experiments performed in triplicate, in which similar results were obtained. Average A595 values are plotted in the graph. (B) Killing assay to assess bactericidal activity against P. gingivalis. Bacterial cells standardized at the concentration of 1 × 10⁴ CFU/mL were treated with PA at various concentrations. The survival rate of P. gingivalis was evaluated by counting CFUs on blood agar plates. For the left graph, data shown were calculated as follows: (CFU at each time point after treatment with PA/CFU at 0 min) × 100 (%). For the right graph, the y-axis shows Log CFU value. Baseline indicates without treatment. Vehicle control indicates treatment with 1% DMSO as a solvent. Note that the bacterial concentration was lower than that used in the growth assay in (A). (C) Cell morphology observed by SEM. Bacterial cells standardized at a concentration of 1 × 10⁸ CFU/mL were treated with PA at 16 μg/mL for 30 min. Representative images are shown. Morphological changes are indicated by arrows for chain-like extrusions and arrowheads for membrane blebbing. (D,E) Assay for enzymatic activity of Rgps (D) and Kgp (E). Culture supernatant from P. gingivalis wild-type strain was preincubated with PA at various concentrations. Residual enzyme activity was measured. The value of enzyme activity for the vehicle control (absence of PA) was considered to be 100%. Data are expressed as the mean ± SD from results obtained in three independent experiments. **p ≤ 0.01 vs. vehicle control. Statistical analysis was performed using ANOVA and Tukey’s multiple comparison test. (F) Ca9-22 cell detachment assay. Ca9-22 cells were incubated with culture supernatant of P. gingivalis wild-type strain without or with preincubation with different concentrations of PA at 110, 221, 443, 885, and 1,770 μg/mL. Bars: 30 μm.

