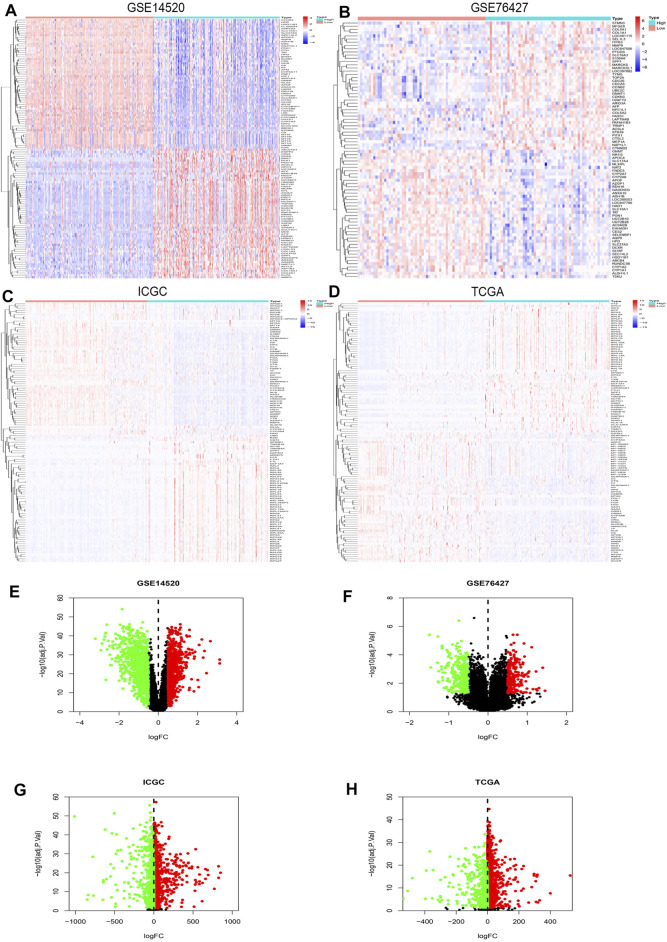
FIGURE 2.
DEGs’ heatmap and volcano plot in GSE14520, GSE76427, ICGC, and TCGA: (A) The heatmap in GSE14520, (B) the heatmap in GSE76427, (C) the heatmap in ICGC, (D) the heatmap in TCGA, (E) the volcano plot in GSE14520, (F) the volcano plot in GSE76427, (G) the volcano plot in ICGC, and (H) the volcano plot in TCGA. In the heatmaps, the high expression represented red, and blue represented the low expression. Red showed the upregulation genes in the volcano plots, and green presented the downregulation genes. In addition, the black dots were not the differential gene in expression in the volcano plots.

