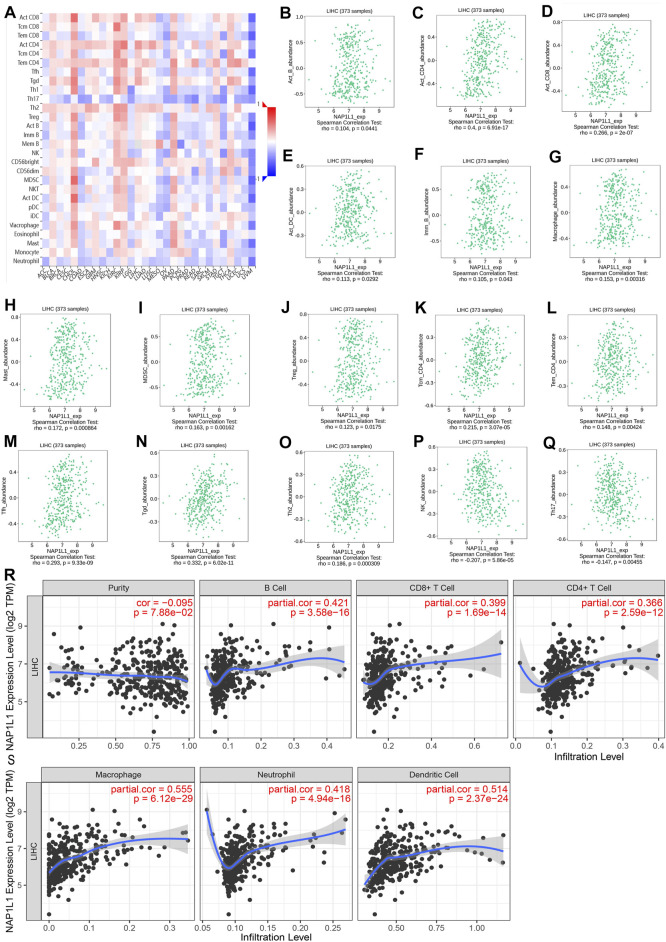
FIGURE 8.
Analysis of immune infiltration in TISIDB and TIMER. (A) The panoramic association between the NAP1L1 expression and TILs in human cancer (red represents the positive correlation, and blue represents the negative correlation). (B–O) The NAP1L1 expression was positively related to the infiltrating levels of the immune cell in HCC. (P,Q) The NAP1L1 expression was negatively related to the infiltrating levels of the immune cell in HCC. (R,S) The NAP1L1 expression is correlated with the level of immune infiltration.

