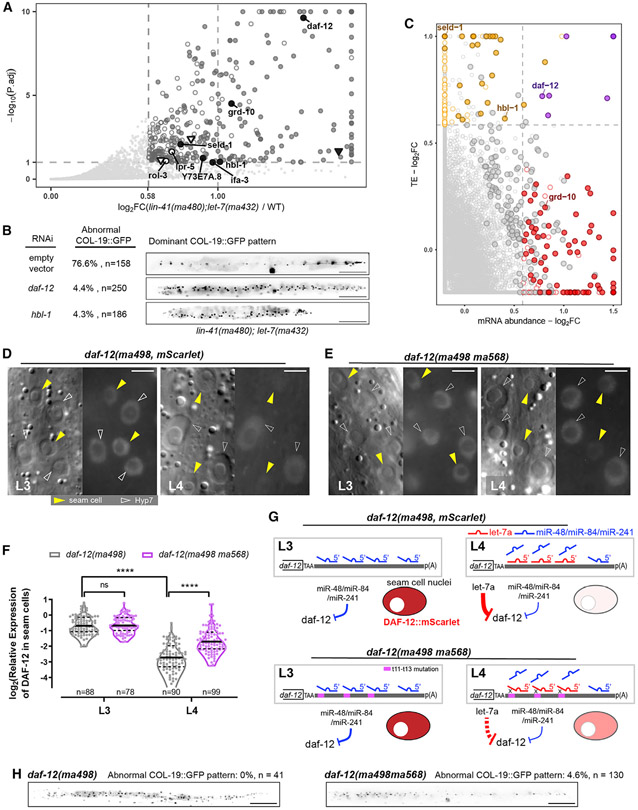
Figure 5. let-7a represses multiple targets, including daf-12 and hbl-1, through 3′ non-seed pairing.
(A) Differential expression analysis of translatomes of lin-41(tn1541ma480);let-7(ma432) and lin-41(tn1541). Hollow points, developmentally dynamic genes for which the observed perturbation could be caused by asynchrony in staging between samples, independently of genotype; solid points, genes for which the observed perturbation is judged to likely reflect an effect of the let-7a mutation specifically (see STAR Methods; Table S3). Circular points with text labels, genes with predicted let-7a 3′ sites; triangle points, genes containing only let-7a seed-only sites.
(B) Retarded COL-19::GFP patterns characteristic of lin-41(tn1541ma480);let-7(ma432) young adults at 25°C under empty vector, daf-12(RNAi), or hbl-1(RNAi). Scale bars, 100 μm.
(C) Fold changes of mRNA abundance and translational efficiency (TE). Red points, genes with significantly increased mRNA abundance. Orange points, genes with significantly increased TE. Purple points, genes with both significantly increased TE and mRNA abundance. Circled points, genes with significantly increased RPFs in (A). Predicted let-7a 3′ targets are text labeled.
(D and E) DIC (left) and fluorescent (right) microscopy images showing expression of DAF-12::mSCARLET at L3/L4 stages at 25°C representative of lin-41(tn1541);daf-12(ma498) (D) and lin-41(tn1541);daf-12(ma498ma568) (E). Scale bars, 5 μm. All of the fluorescent images were generated with identical exposure and processing conditions.
(F) Quantification of relative fluorescent intensity of DAF-12::mSCARLET in seam cell nuclei relative to the adjacent Hyp7 nuclei. The numbers of seam cells quantified are shown under each violin plot. A total of 22 and 28 animals were scored for daf-12(ma498) at L3 and L4, respectively; 23 and 31 animals were scored for daf-12(ma498ma568) at L3 and L4, respectively.
(G) Models for daf-12 repression at L3/L4. Purple region, trinucleotide mutations that disrupt duplexing with g11–g13 of let-7a.
(H) Representative expression patterns of COL-19:GFP in adult animals. Scale bars, 100 μm.
Data in (A) and (C) represent 3 biological replicas. See also Figures S6 and S7.

