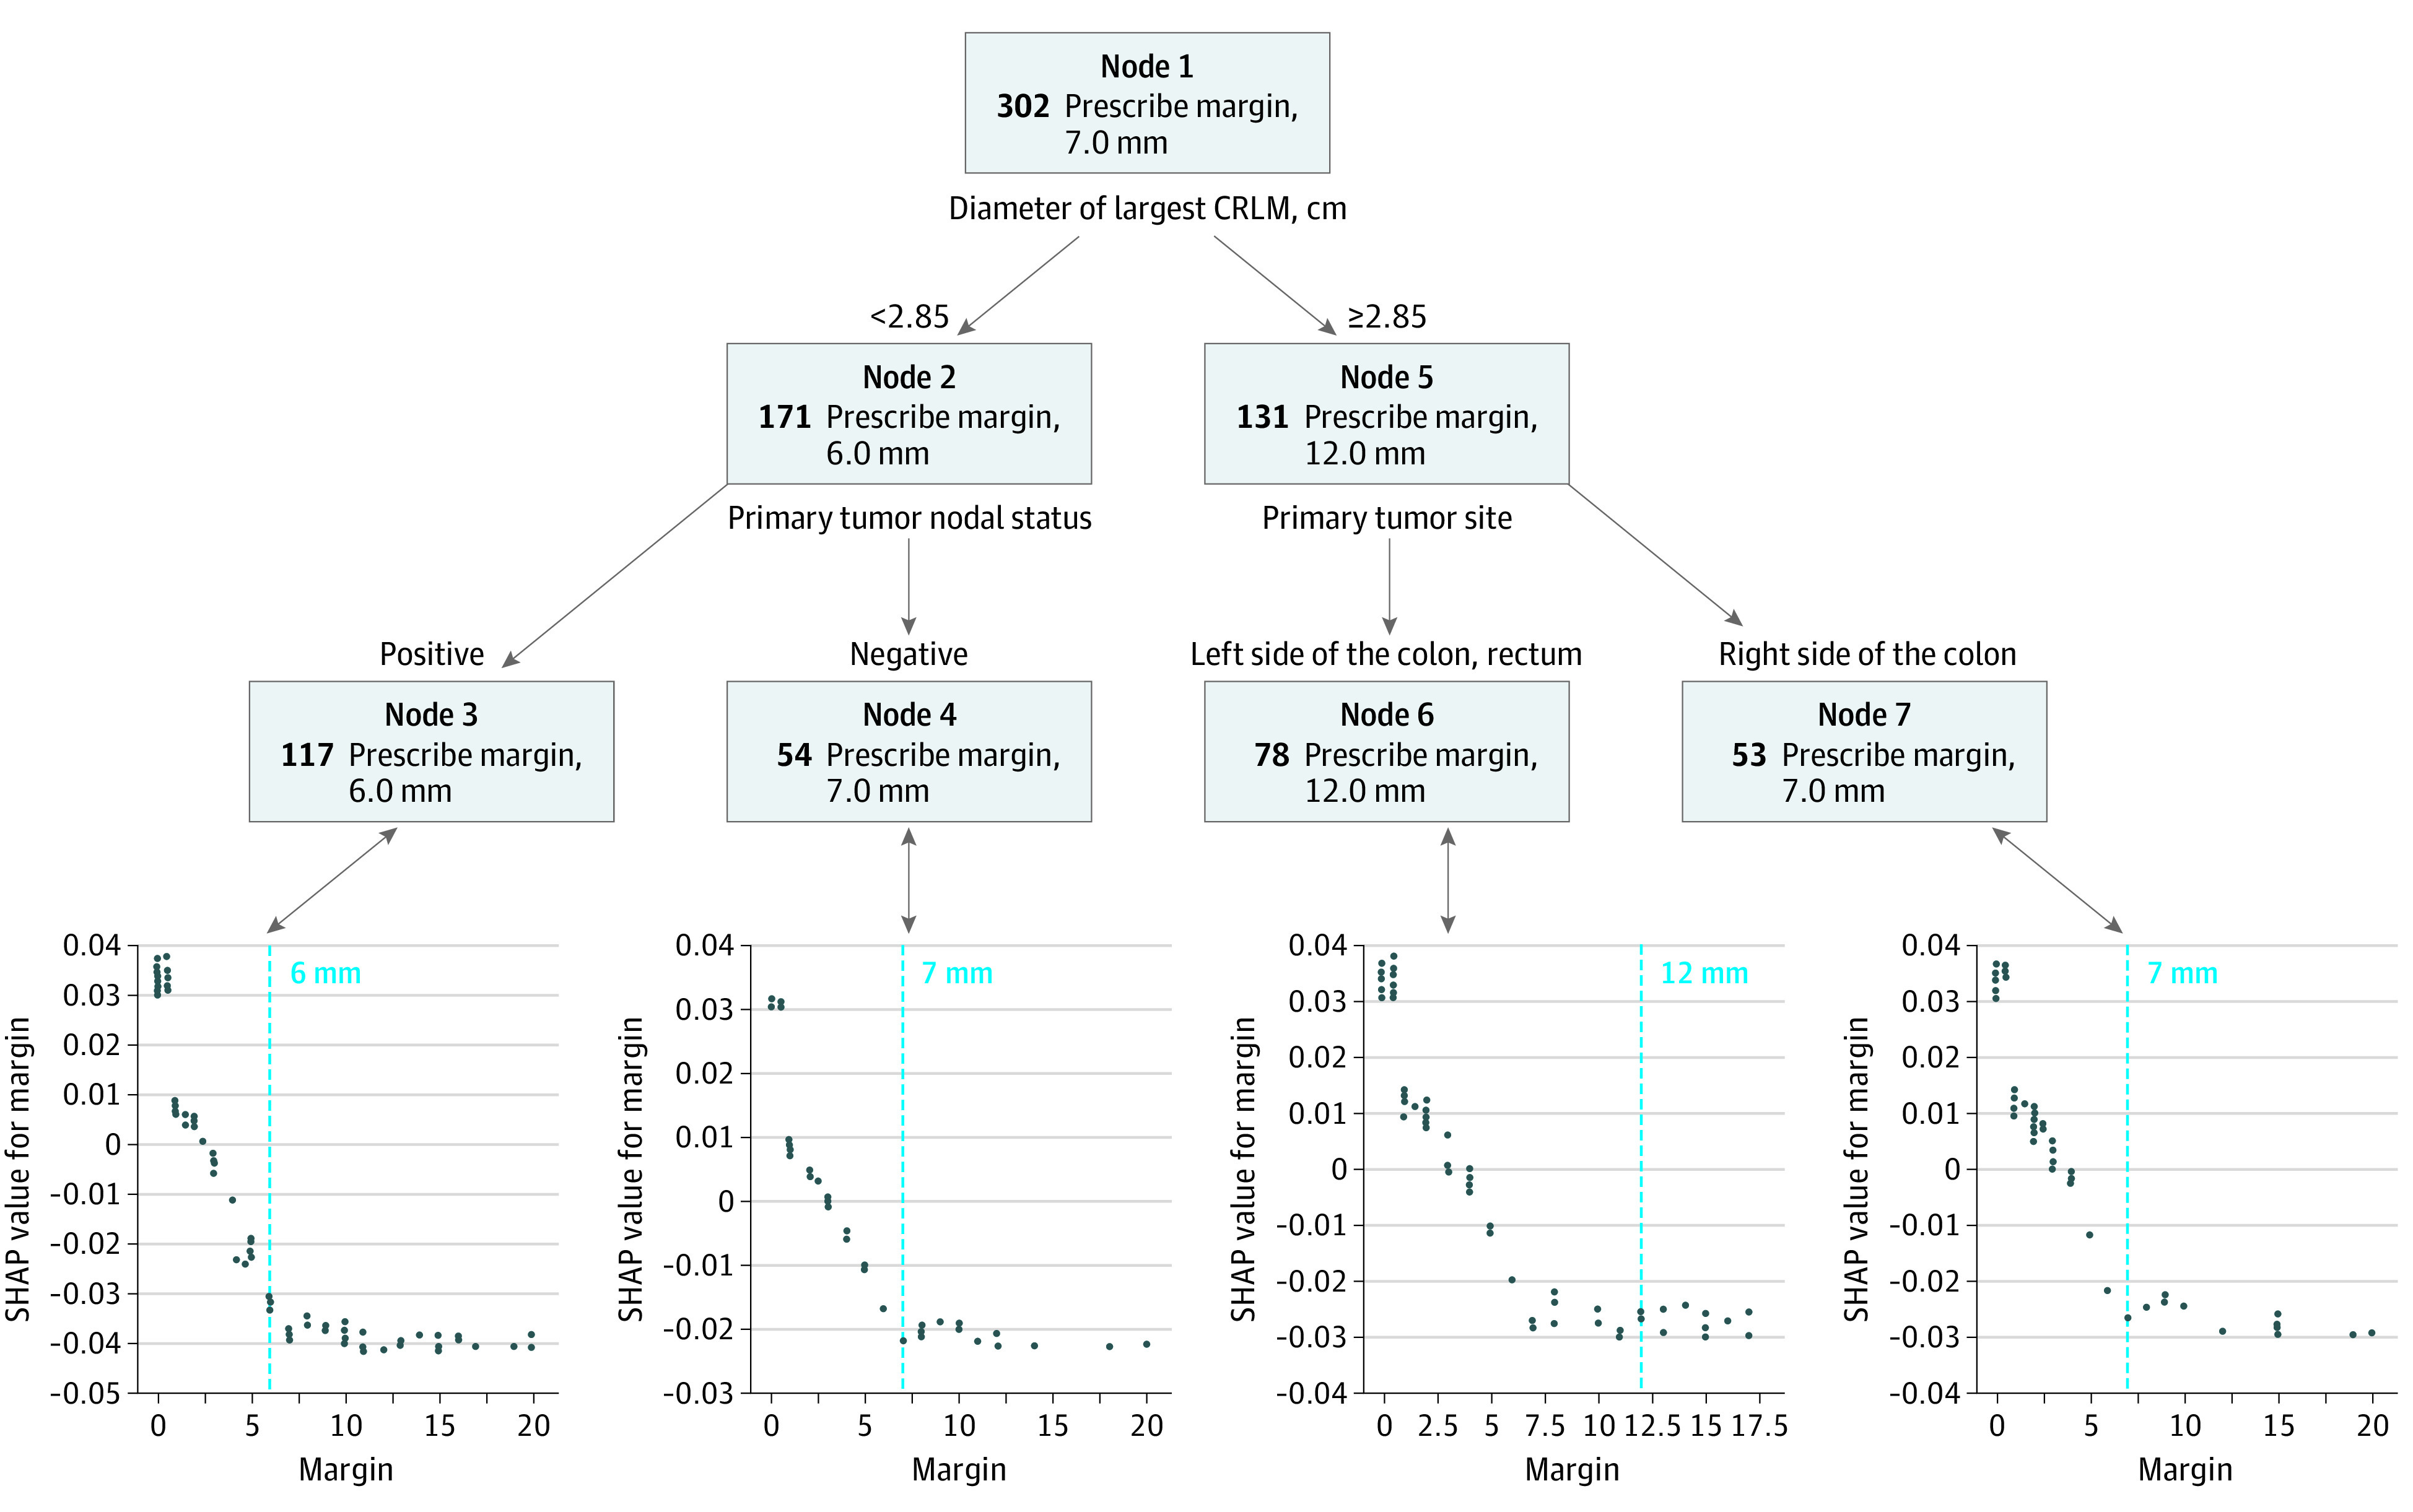
Figure 1. Optimal Policy Trees (OPTs) and Shapley Additive Explanations (SHAP) Plots for Overall Survival in Patients With KRAS-Variant Tumors .

In the upper part of the figure is the OPT analysis (a methodology devised by the collaborating group from Massachusetts Institute of Technology), which suggested optimal margins of 6 to 7 mm, with the exception of group C for which the optimal margin was 12 mm. In the lower part of the figure is the SHAP analysis (a methodology devised by a group from Microsoft), which also suggested optimal margins of 6 to 7 mm (these were the margins associated with the lowest SHAP value and thus the lowest risk of death), with the exception of group C for which the optimal margin was 7 mm. In the SHAP plots, the OPT margin value that was associated with the maximum risk reduction for the specific patient subgroup is depicted by the vertical dashed line. The decrease in risk of death associated with a margin of 7 vs 6 mm is similar in nodes 4 and 7. CRLM indicates colorectal cancer liver metastases.
