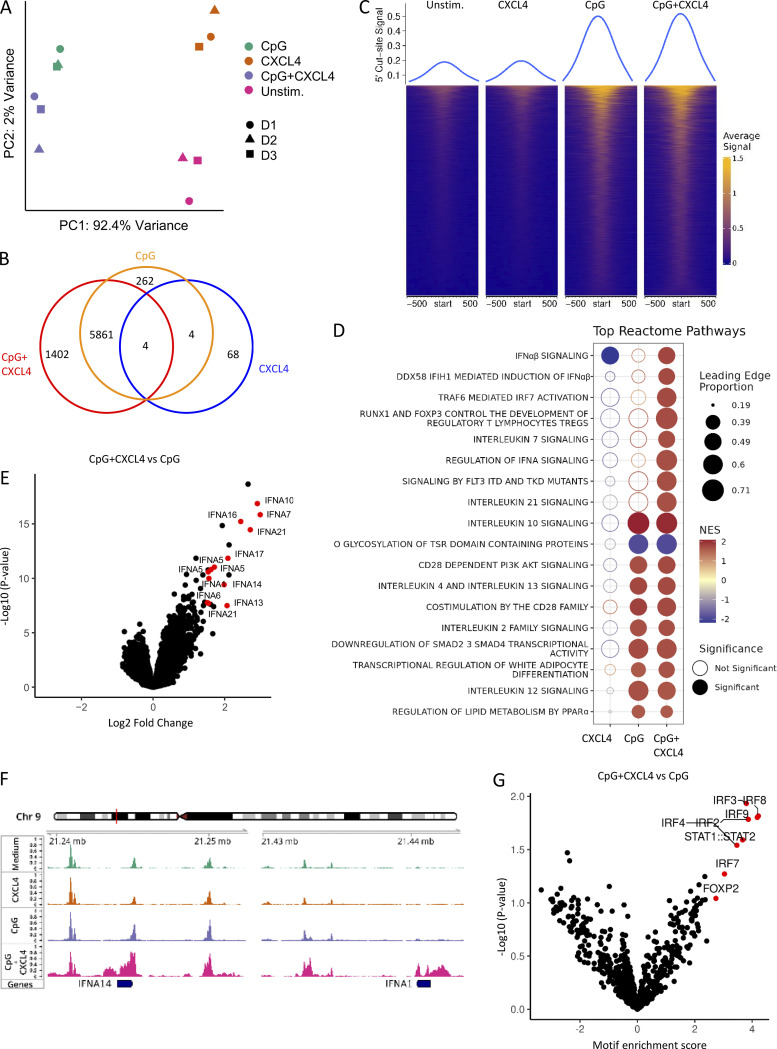
Figure 3.
CpG DNA and CXCL4 increase IFN-I loci chromatin accessibility. (A–G) Purified pDCs from HDs (n = 3) were left unstimulated (Unstim.) or cultured with CXCL4 or CpG, alone or with CXCL4, for 6 h and analyzed for chromatin accessibility analysis (ATAC-seq). (A) PCA of a total of top 10,000 most variable ATAC-seq peaks for unstimulated, CXCL4, CpG, and CpG + CXCL4 conditions. (B) Venn diagram showing overlapping and distinct differential ATAC-seq peaks across CXCL4, CpG, and CpG + CXCL4 versus unstimulated condition. (C) Enrichment heatmaps of normalized chromatin accessibility reads of ATAC-seq under unstimulated, CXCL4, CpG, and CpG + CXCL4 conditions. The top lines represent the peak signal of each condition at 5′ cut site. Blue and yellow indicate the min and max of the average signal of three replicates. (D) Reactome pathway analysis of genes associated with the differential OCRs between CXCL4, CpG, and CpG + CXCL4 versus unstimulated condition. Color scale represents the normalized enrichment score (NES); blue and red indicate negative and positive NES, respectively. Only pathways with NES > 1.5 or less than −1.5 were picked. The size of dots represents the proportion of genes (linked to differential peaks) associated with a pathway. Empty and solid circles represent insignificant and significant results, respectively, with a cutoff adjusted P value of <0.05. (E) Volcano plot of differentially opened loci under CpG + CXCL4 versus CpG (FDR < 0.05). (F) Representative average signal tracks showing IFN14 and IFNA1 loci. (G) Enrichment analysis of motifs (JASPAR2020) in ATAC peaks showing relative motif enrichment in CpG + CXCL4 versus CpG.

