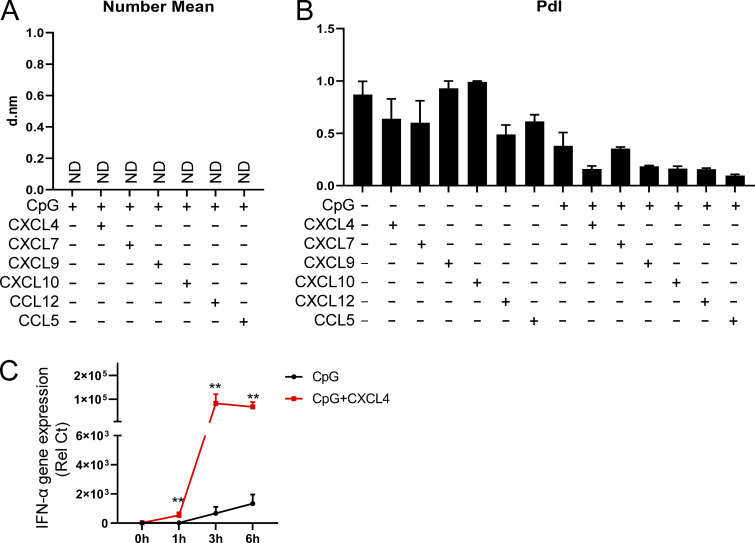
Figure S4.
The size and PdI of nanoparticles and the time course of the effect of CXCL4-CpG nanoparticle on TLR9-induced IFN-α. (A) Nanoparticle size (number mean) measurement of chemokines (10 μg/ml) in PBS by DLS. Samples that didn’t meet the quality control criteria are indicated as ND. d.nm, diameter in nanometers. (B) Nanoparticle PdI measurement of chemokines (10 μg/ml), CpG DNA (0.1 μM), and the indicated combinations in PBS by DLS. (C) Purified pDCs from HDs (n = 6) were left unstimulated (0h) or incubated with CpG, alone or with CXCL4, for 1, 3, and 6 h. The expression of IFN-α was quantified by Q-PCR. All results are represented as means ± SEM. Statistical significance was evaluated using Mann–Whitney U test, and only comparisons that are significant are shown. **, P < 0.01.

