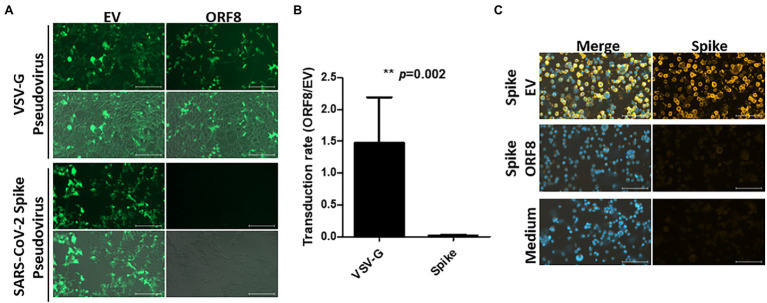
Figure 1.
ORF8 production abrogates the production of SARS-CoV-2 Spike pseudovirus. VSV-G and SARS-CoV-2 Spike pseudoviruses were produced in HEK293T cells by transfecting plasmids encoding Gag-pol or envelope protein (VSV-G or spike) and package plasmids encoding IRES-GFP (EV) or ORF8-IRES-GFP (ORF8). The same amount of viral supernatant from each sample were assayed to determine its transduction efficiency using HEK293T/hACE2 cells. The transduction efficiency were measured by fluorescence microscopy and flow cytometry 4 days after transduction. (A) Representative fluorescence microscopy data. For each result, the upper figure shows the GFP signal only and the lower figure shows the merged figure combined with the photo obtained by phase contrast. (B) The transduction rate of pseudoviruses prepared with ORF8 vs. control plasmids were quantified by flow cytometry from 5 independent experiments. (C) The purified Spike pseudoviruses were exposed to HEK293T/hACE2 cells on ice with rolling for 1 h. After extensive washes with PBS to remove the unbound viral particles, the bound viral particles were visualized using an antibody against the spike protein with a Cy3-labeled secondary antibody; DAPI were applied for nuclear staining. The data are shown as the means ± SDs (error bars). Student’s t-test was used, and p < 0.05 indicates a statistically significant difference; ** p < 0.01. The scale bar in (A) represents 200 μm and in (C) represents 100 μm.

