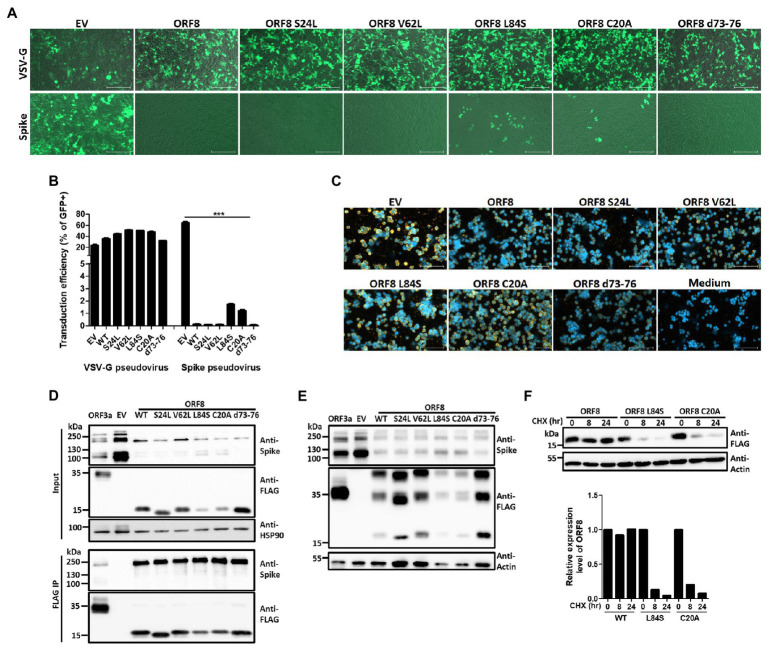
Figure 5.
Impact of ORF8 mutations on regulating the spike protein and their own stability. Spike or VSV-G pseudoviruses were produced using the pLAS2-IRES-GFP (EV) lentiviral vector or the same vector carrying different ORF8 mutants shown as mutation sites. After the purification of these pseudoviruses, an equal amount of viral supernatant was used to test their transduction efficiencies in HEK293T/hACE2 cells, which were observed as GFP-positive cells 4 days post-transduction and were (A) visualized by fluorescence microscopy and (B) quantified by flow cytometry. EV: empty vector; WT: wild type. (C) The relative quantity of Spike pseudoviruses in these samples was evaluated by a binding assay of HEK293T/hACE2 cells exposed to the same volume of different viral samples, and samples were then visualized with a polyclonal antibody recognizing the spike protein and a Cy3-conjugated secondary antibody. DAPI was used for staining nuclei. (D) Co-immunoprecipitation assays were performed using HEK293T cells cotransfected with spike-encoding plasmid together with pLAS2-based plasmid carrying different ORF8 mutants 3 days post-transfection. Here, a polyclonal antibody against the spike protein was used. (E) A set of Samples similar as (D) was prepared in non-denature condition and subjected to immunoblotting experiment. (F) A cycloheximide-tracing experiment was performed with cells transfected with a plasmid encoding wild-type ORF8, L84S, or C20A mutation. The transfected cells were treated with 100 μg/ml cycloheximide at 24 h post-transfection. Immunoblots of the samples collected from the indicated time points after cycloheximide treatment were performed using an anti-FLAG antibody. Antibody against actin served as a control. The protein stability of each ORF8 mutant shown in was evaluated by comparing the protein amounts of ORF8 and actin quantified using the ImageJ software. The bar figure in (B) shows the means ± SDs (error bars). The unpaired Student’s t-test was used, and p < 0.05 indicates a statistically significant difference; ***p < 0.001. The figure shows the statistical analyses of the comparisons of EV vs. all ORF8 variants, WT vs. L84S, and WT vs. C20A. The scale bar in (A) represents 200 μm and (C) represents 100 μm.

