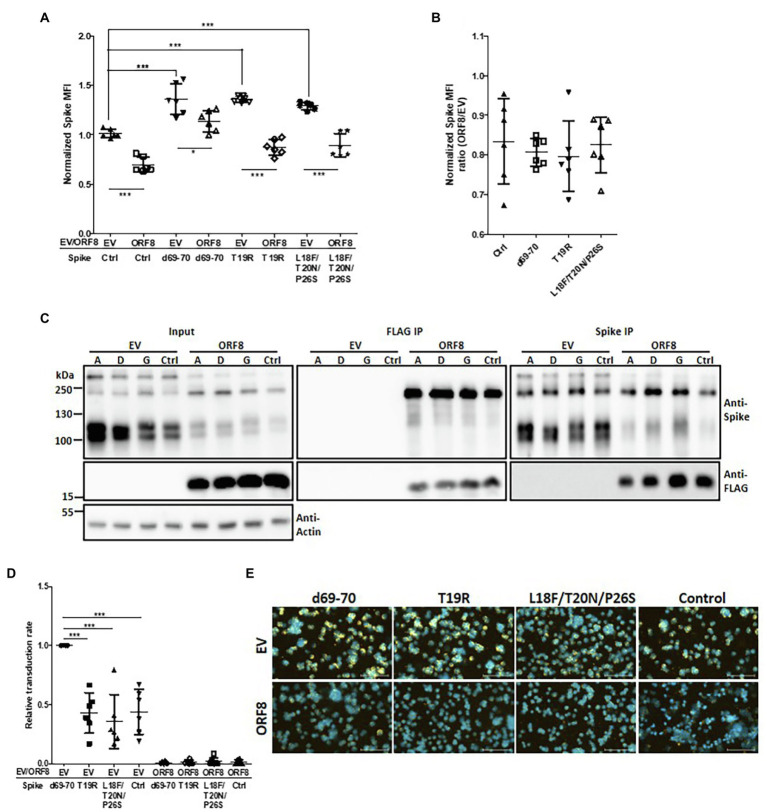
Figure 6.
Influence of spike mutations on ORF8-mediated downregulation of the spike protein. (A) HEK293T cells were cotransfected with the different spike-encoding plasmid together with the pLAS2-ORF8-IRES-GFP (ORF8) or pLAS2-IRES-GFP (EV) plasmid. Three days after transfection, the cells were collected for flow cytometry using antibodies against the spike protein. Here the results were collected from six-independent experiments after normalization. Ctrl: control spike plasmid without the indicated modifications. (B) The same results of (A) but shown as the ratio between ORF8 and EV groups. No significant difference was observed. (C) HEK293T cells were cotransfected with an ORF8-encoding plasmid together with a plasmid encoding spike protein with the indicated mutations. The cells were collected at 3 days post-transfection and subjected to immunoprecipitation assays. Immunoblotting analysis of the total cell lysates and the immunoprecipitates were performed using antibodies against the spike protein, FLAG tag, and actin. Abbreviations of Spike mutants: A: d69-70; D: T19R; G: L18F/T20N/P26S. (D) Spike pseudovirions were produced using a plasmid encoding different spike envelopes together with the lentiviral vector pLAS-IRES-GFP (EV) or pLAS-ORF8-IRES-GFP (ORF8). After purification of the pseudovirions, their transduction efficiency was evaluated by exposing HEK293T/hACE2 cells to the same amount of viral supernatant. The percentages of GFP-positive cells the transduced cells were evaluated by flow cytometry and normalized with EV d69-70 sample in each experiment. (E) The relative quantity of Spike pseudoviruses in the same samples shown in (D) was evaluated by a binding assay of HEK293T/hACE2 cells exposed to the same volume of different viral samples, and samples were then visualized with a polyclonal antibody recognizing the spike protein and a Cy3-conjugated secondary antibody. DAPI was used for staining nuclei. The scatter plot figures in (A,B,D) show the mean ± SD (error bars). Unpaired Student’s t-test was used in (A,B) and paired Student’s t-test was used in (D). p < 0.05 indicates a statistically significant difference; *p < 0.05, ***p < 0.001. The scale bar represents 100 μm.

