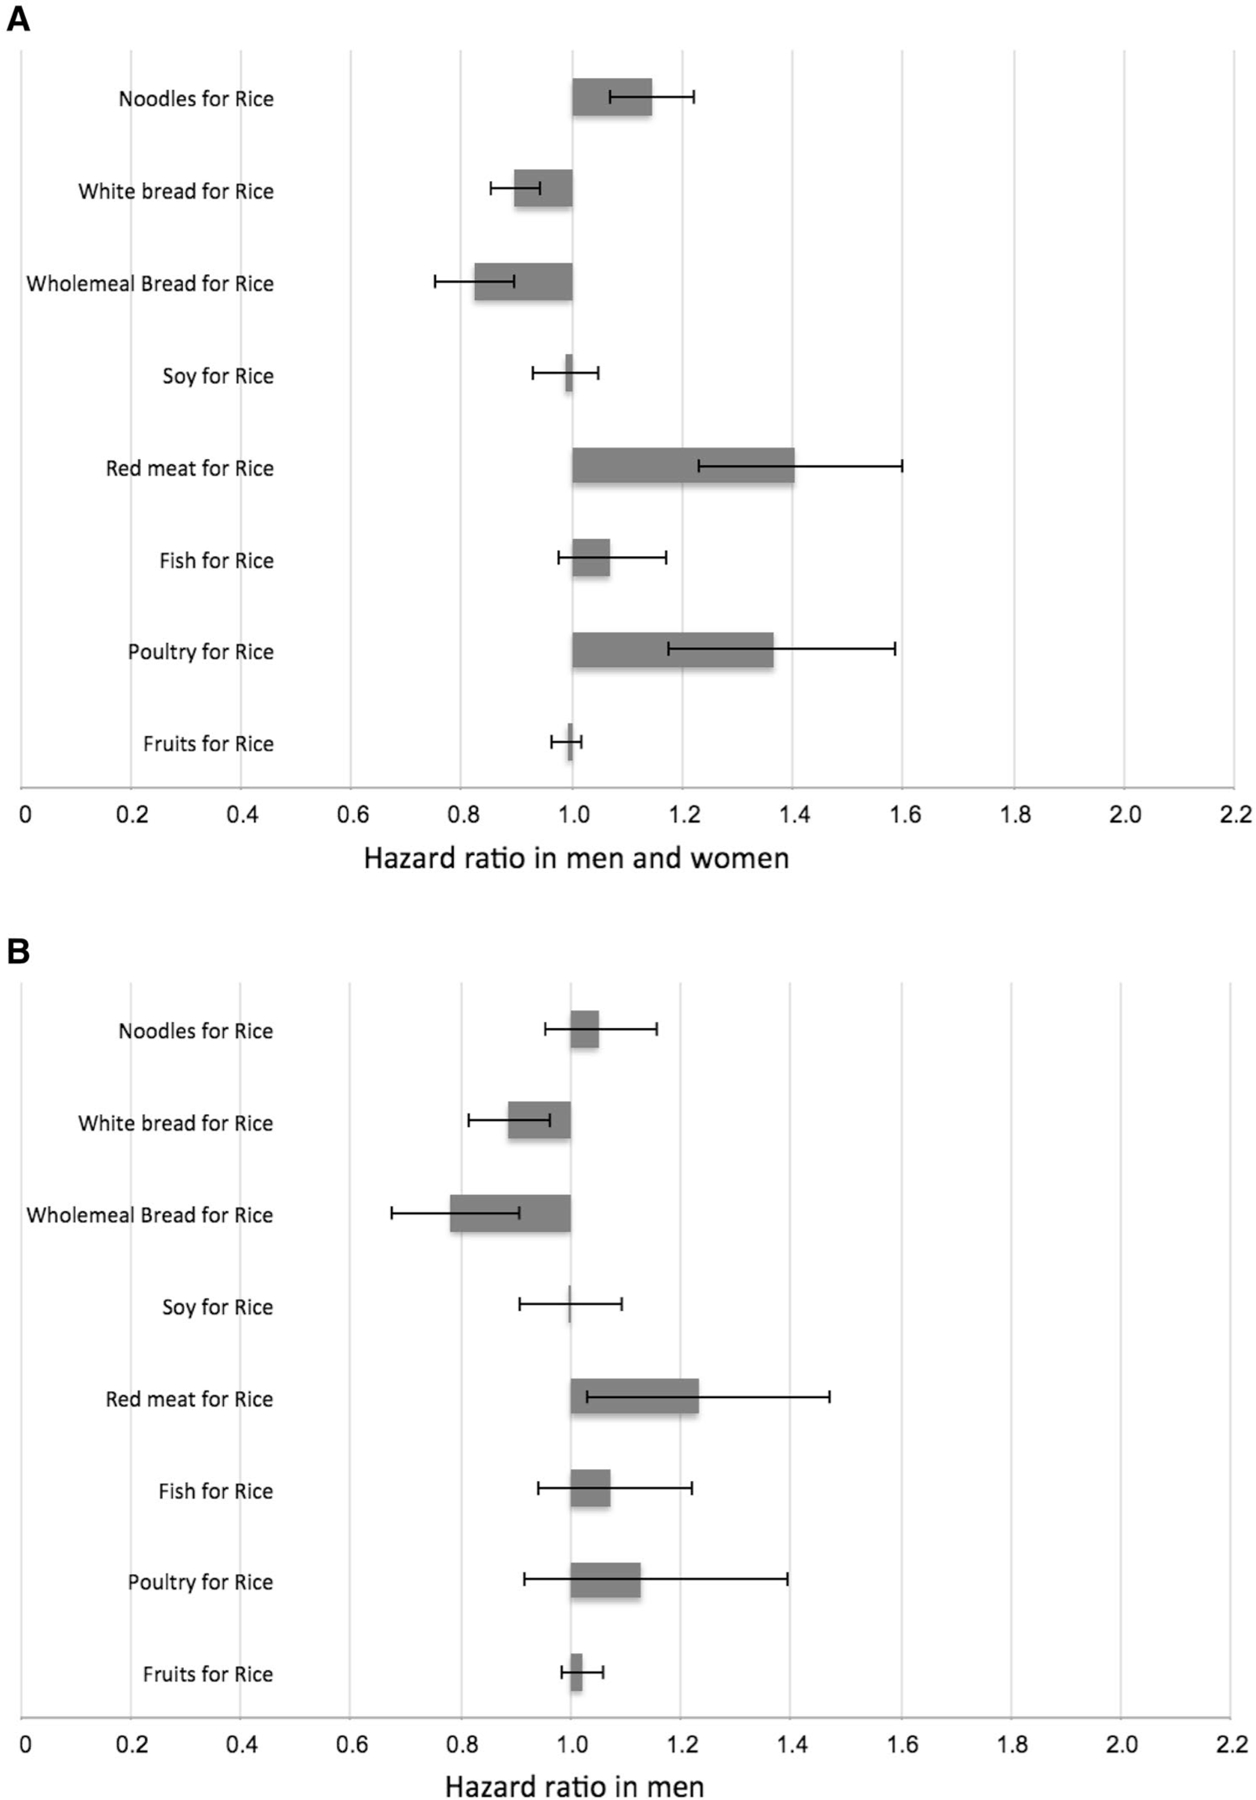
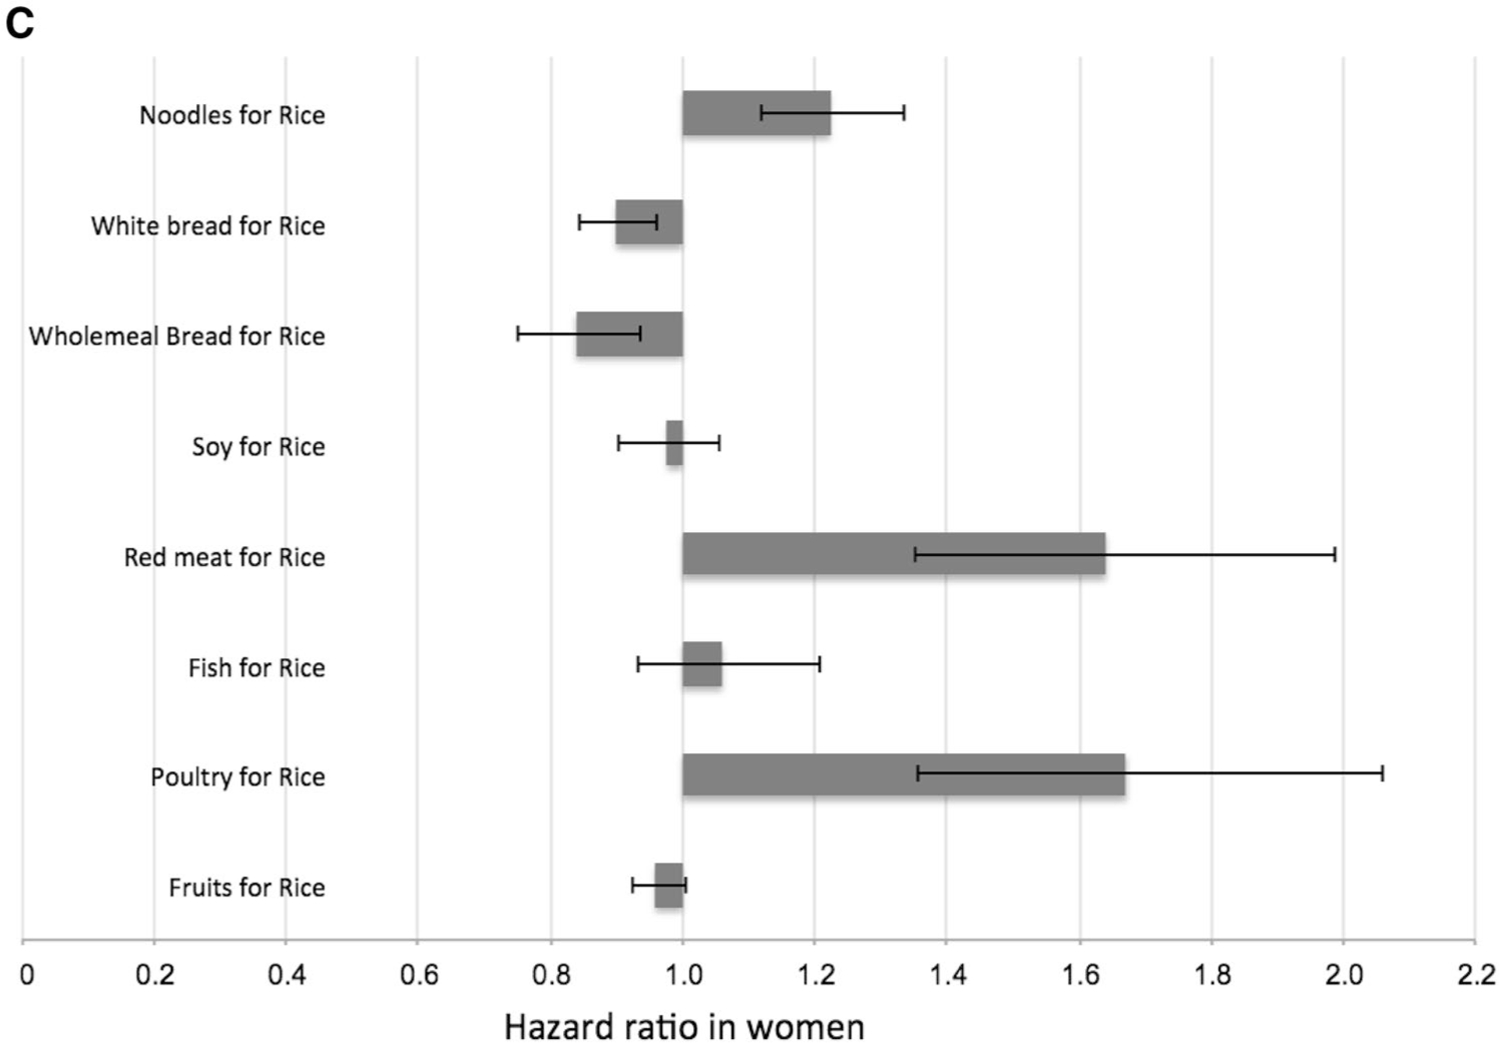
Fig. 2.


Estimated hazard ratio (95% confidence intervals) associated with the substitution of one serving of rice (100 g) for one serving of noodles (100 g), white bread (60 g), wholemeal bread (60 g), soy (170 g), red meat (90 g), fish (90 g), poultry (90 g) and fruits (130 g). Data are shown for all participants (a; n = 45,411), men (b; n = 19,409) and women (c; n = 26,002). Data were analyzed using the lifestyle-adjusted Cox proportional hazard regression model (see footnotes to Table 2), and substitution effects were estimated using a published method (33, 34)
