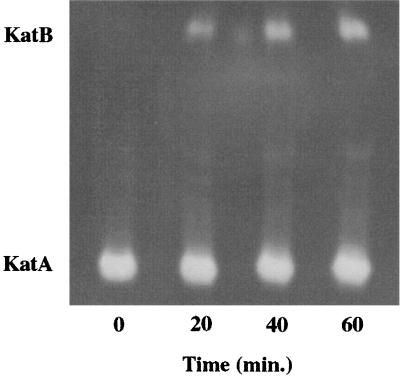
FIG. 4.
PAO1 biofilm catalase isozyme expression patterns during treatment with a continuous dose of 50 mM H2O2. Samples were harvested at 20-min intervals for a period of 1 h. Cell-free extracts were loaded on a 5% nondenaturing polyacrylamide gel, electrophoresed to allow separation of the KatA and KatB enzymes, and then stained for catalase activity. Each lane was loaded with 15 μg of total protein. Results are from a single experiment but are representative of three experiments conducted.

