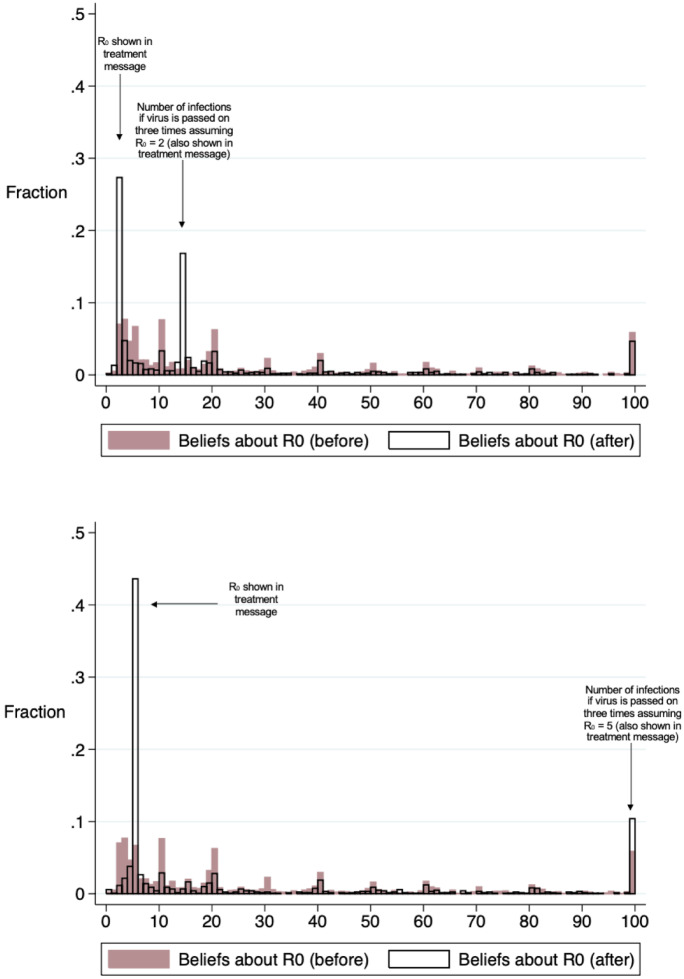
Fig. 3.
Effect of treatments on posterior beliefs of . Notes. The first diagram displays the distribution of beliefs about in the lower-bound group pre- (prior) and post-treatment (posterior). The second diagram displays the distribution of beliefs about in the upper-bound group pre- and post-treatment. Participants can enter any number between 0 and 100 when stating their beliefs about

