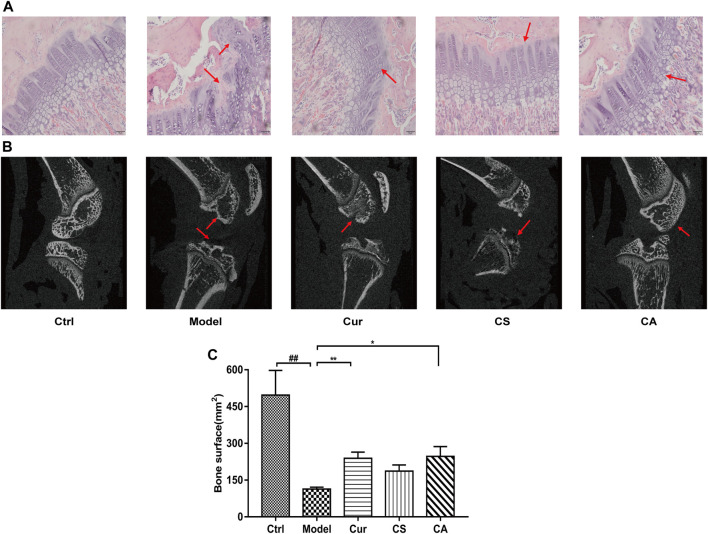
FIGURE 2.
Protection of different administration groups on knee osteoarthritis in MIA-induced rats. (A) Representative histological staining and (B) CT scanning of the knee joint of different groups. Scale bar = 50 μm. (C) Bone surface. Data are presented as the mean ± SD (n = 4). ## p < 0.01 vs. Ctrl group; *p < 0.05, **p < 0.01 vs. model group.

