FIGURE 3.
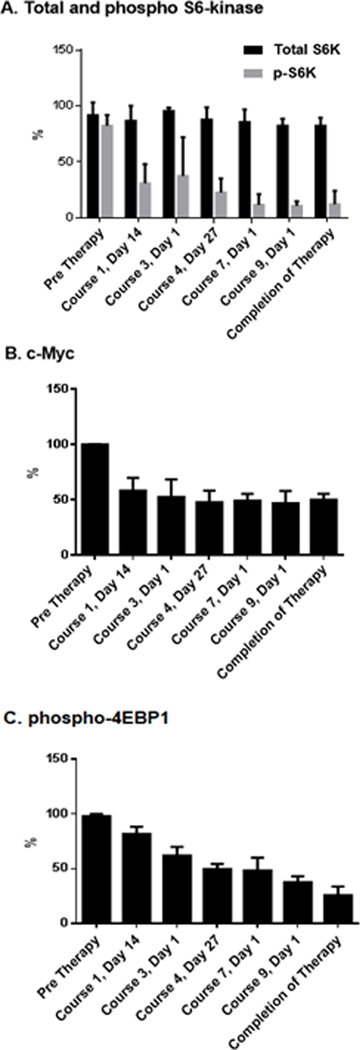
Pharmacodynamic markers. (A) Sustained modulation of S6K phosphorylation and (B) c-MYC expression with Everolimus. (C) Progressive modulation of 4E-BP1 phosphorylation with Everolimus. Data was normalized to highest value within each patient group using two-way repeated measures ANOVA (n=8)

