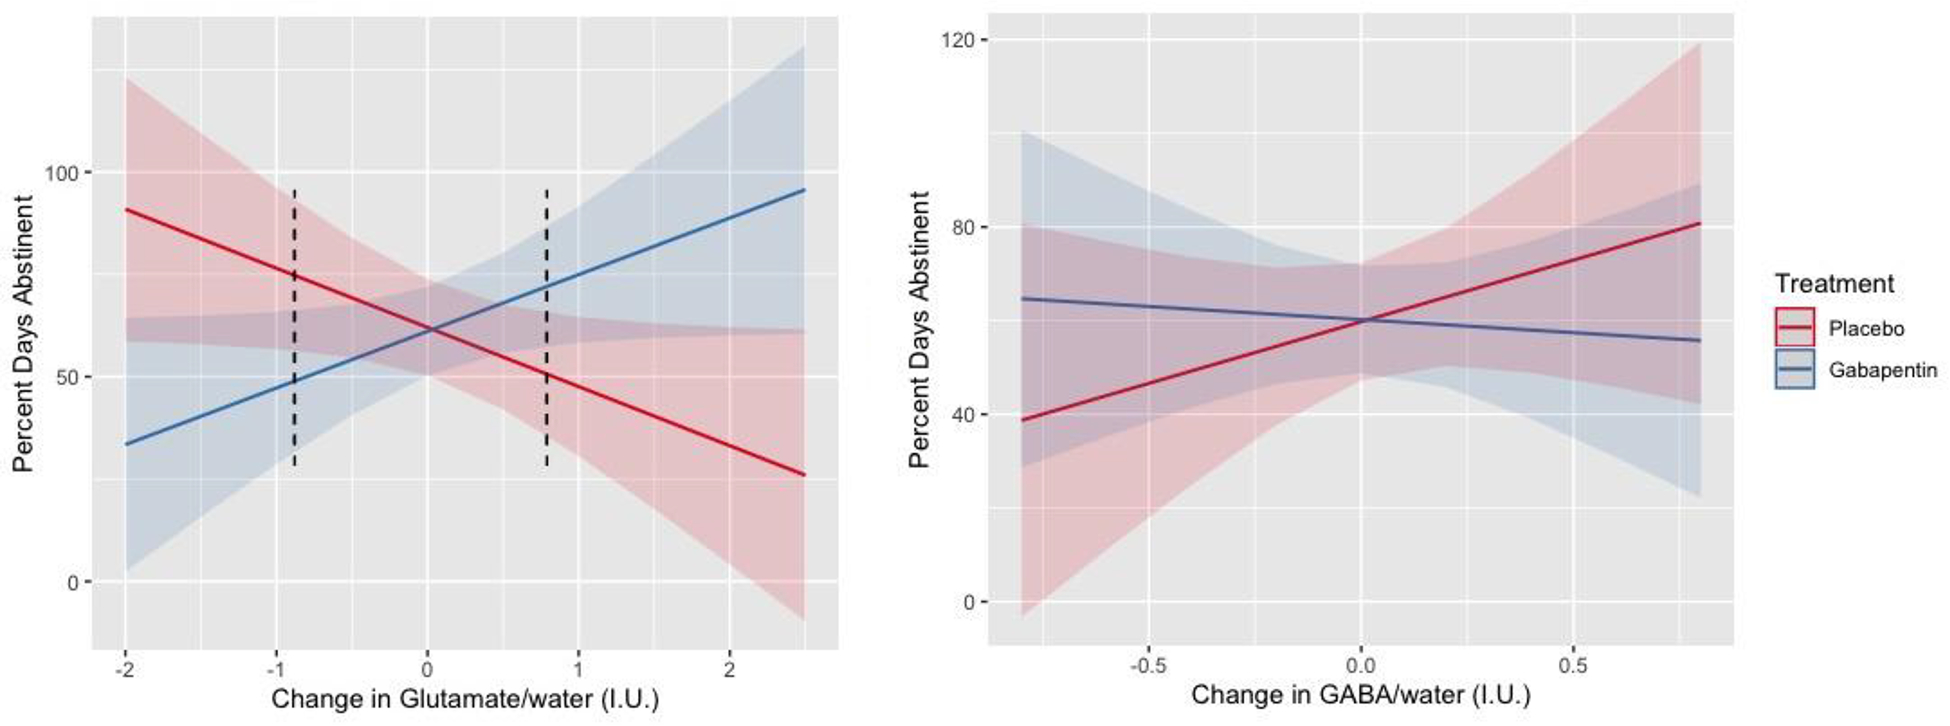
Figure 4.

Percent days abstinent following scan 2 (i.e., early treatment; y-axis) by change in dorsal anterior cingulate cortex (dACC) glutamate (n=64, left) and GABA (n=67, right) levels (x-axes), normalized to water and expressed in Institutional Units (I.U.), by treatment group (red line = placebo, blue line = gabapentin). Error bands represent 95% confidence intervals. Dark dotted lines represent the p < 0.05 threshold of Johnson-Neyman significance regions.
