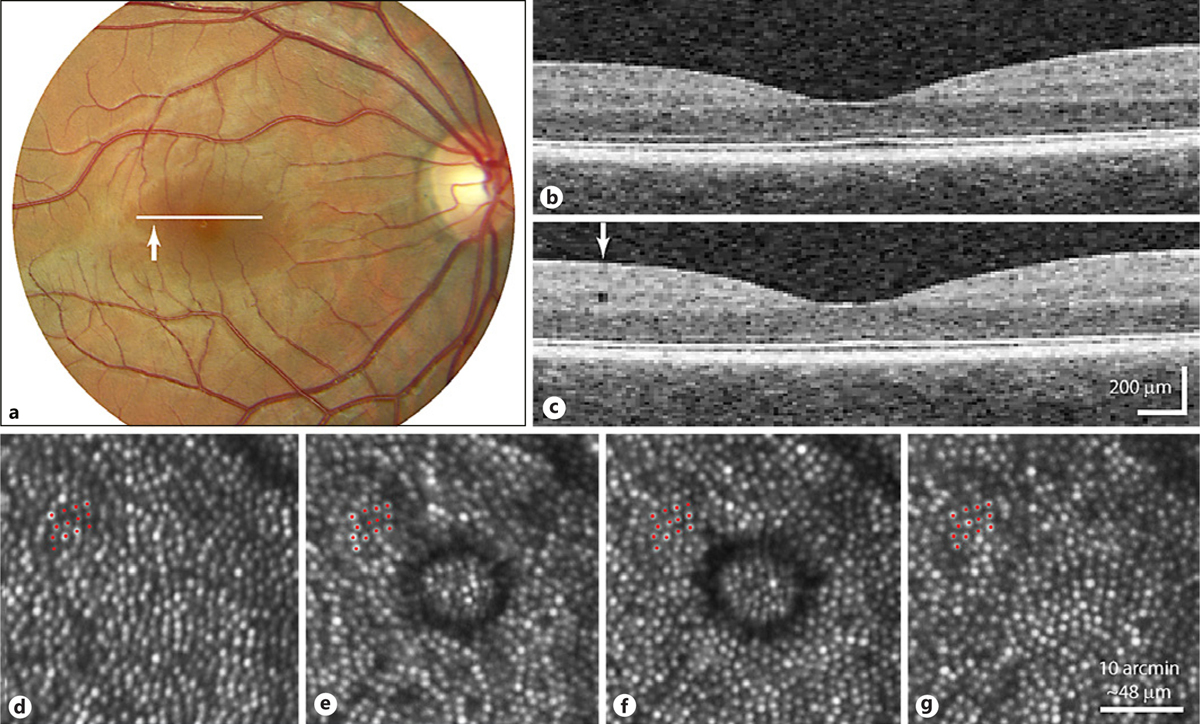
Fig. 1.

Visualization of a retinal microcyst with OCT and AOSLO imaging. a A fundus photograph of the patient’s right eye. The cross-section of the OCT scans is represented by the white line, while the location of the microcyst is depicted by the white arrowhead at approximately 3.7° temporal to the fovea. b OCT image through the location depicted in a, taken from a scan acquired over a year before the remaining images were captured. c OCT image through the same location as in b, showing the appearance of the microcyst in the inner nuclear layer 1 day after first discovery. The field of view of the OCT images has been cropped, rendered with isotropically scaled pixels. Scale dimensions are approximate, based on instrument manufacturer’s assumptions about eye dimensions. d An AOSLO image of the area that the cyst appeared in, acquired 13 months earlier. d–g Red dots mark the same 13 cones. e The first appearance of the microcyst with AOSLO. f The last microcyst image, taken 22 days after the first image. g The microcyst appeared completely resolved here, 29 days after the first image.
