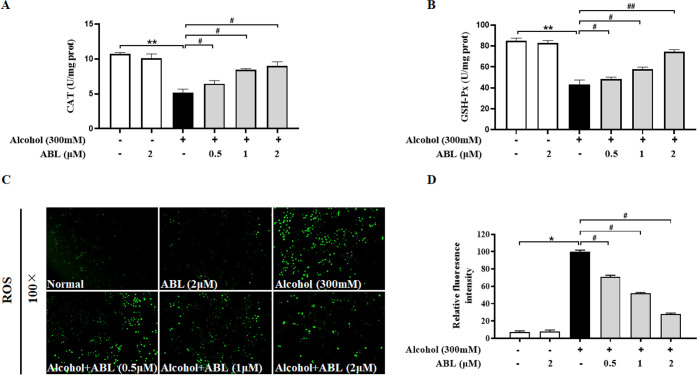
Figure 2.
Effects of different concentrations of ABL against alcohol-induced oxidative stress. Levels of (A) catalase (CAT) and (B) glutathione peroxidase (GSH-Px) in alcohol-induced LO2 cell injury. (C) Improvement effects of ABL with different concentrations (0.5, 1, and 2 μM) on reactive oxygen species generation in alcohol-induced LO2 cells. (D) The relative levels of fluorescence intensity were quantified at a magnification of ×100. * p < 0.05, ** p < 0.01 vs control group; #p < 0.05, ##p < 0.01 vs alcohol-treated group.

