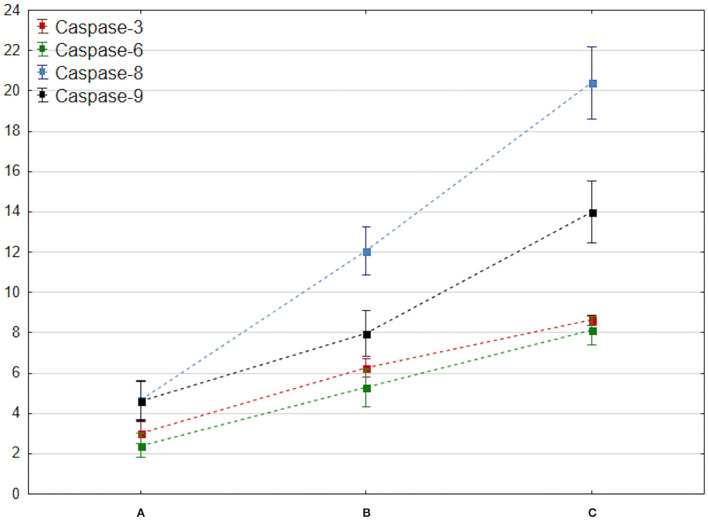
Figure 2.
Comparison of changes in mean caspase 3–9 values at admission, 72 h, and 7 days after brain trauma. These measurement dates are marked with the letters A, B, and C and placed on the x-axis. The mean value of caspase 3–9 (y-axis) is marked with a square, while the ends of the whiskers indicate mean-95% CI and mean + 95% CI, respectively.

