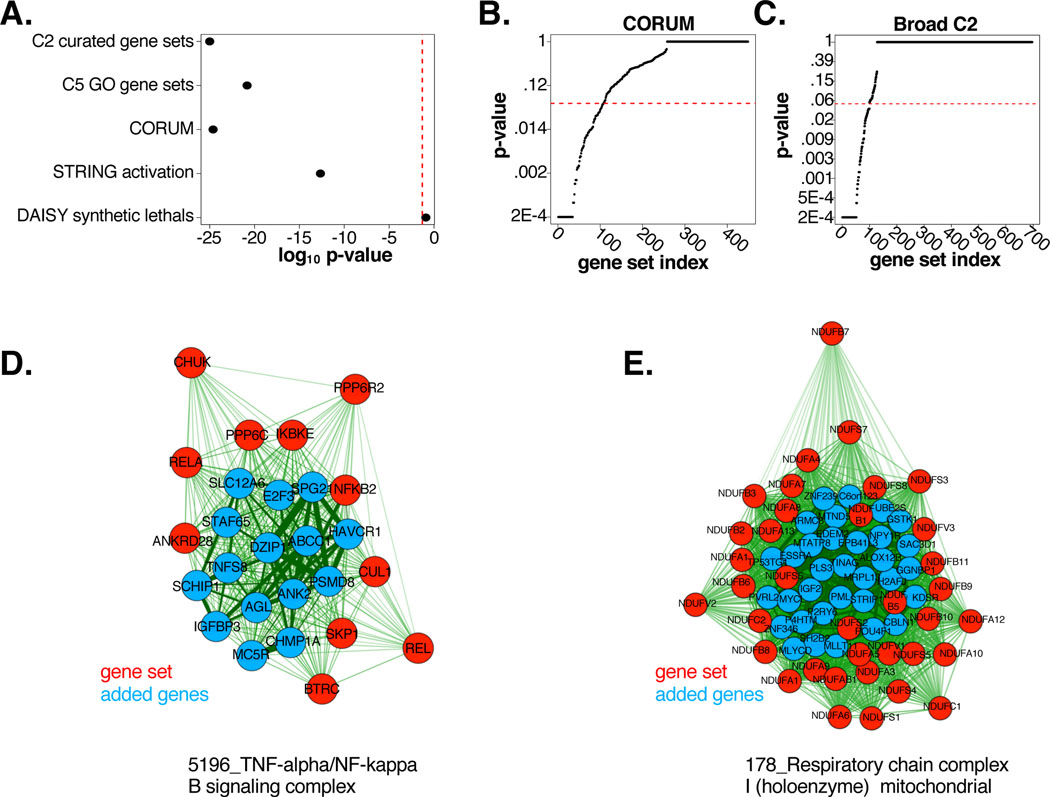
Figure 2: Reannotation of biological gene pathways with FuSiOn.
(A) HG p-values for gene set enrichment amongst FuSiOn edges. Sets: MSigDB V3 (C2, p<2.2E-208; and C5, p=1.5E-21), CORUM (p=2.4E-25), STRING activation edges (p=2.19E-13), and DAISY synthetic lethal database (p=0.12)
(B-C) p-values (KS test) indicating enrichment of FuSiOn similarity edges for each set in (B) CORUM and (C) C2
(D-E) (D) ‘5196_TNF-alpha/NF-kappa B signaling complex’ and (E)178_Respiratory chain complex I (holoenzyme) mitochondrial were significant in (B-C). Red=pre-annotated genes; blue = added genes. Length and line thickness of edges are proportional to Euclidean distances.

