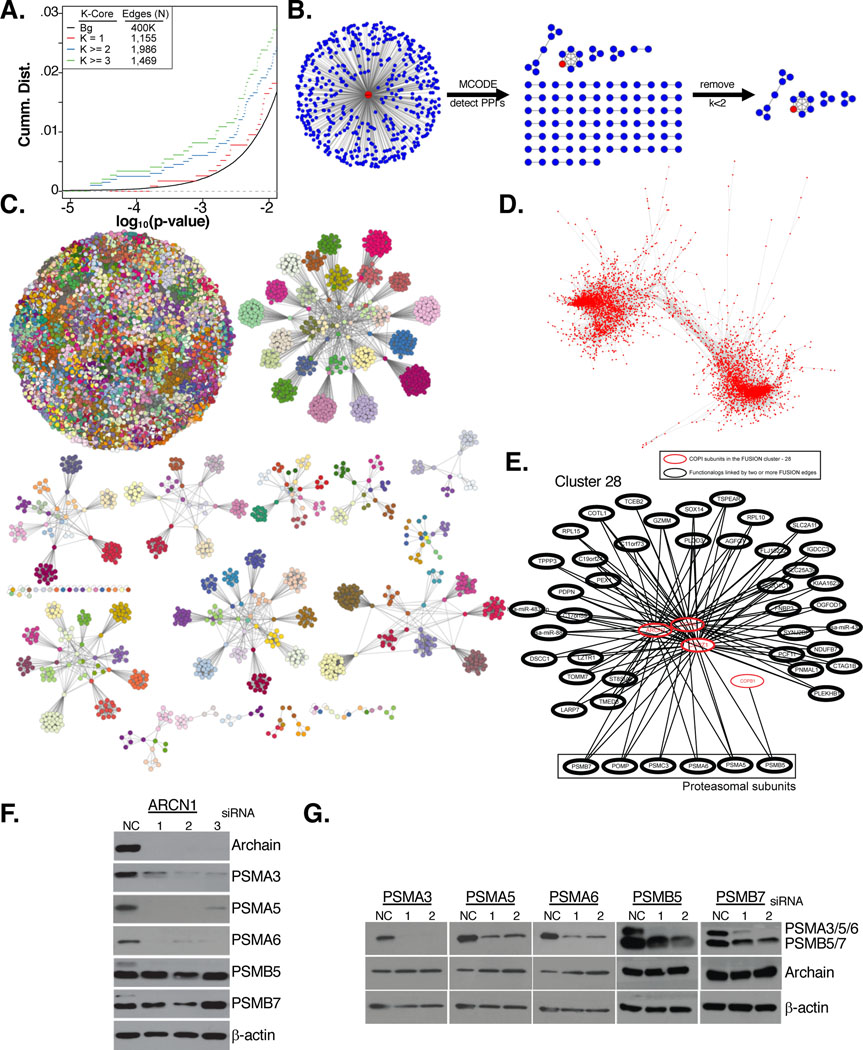
Figure 3: Network analysis of FuSiOn siRNA perturbations.
(A) CDF of the p-values for the FuSiOn edges represented in the PPI network grouped by the minimal k-core membership compared to genetic perturbations with no physical interaction (background)
(B) The top 500 closest siRNAs to a query perturbation (red) were subjected to an MCODE analysis to detect for enrichment of PPI’s. PPI’s were further filtered to select for a minimal of 3 (k>=2) proteins in each complex
(C) AP clustering of the siRNA perturbations by their functional signatures using Euclidean distance as a similarity metric. Nodes are colored according to cluster membership
(D) FuSiOn network drawn by force-directed graph(n edges= 188,802)
(E) Cluster 28 includes four COPI genes (red) and 6 proteasomal subunits (box)
(F-G) HCT116 cells were treated with siRNAs targeting (F) ARCN1 or (G) 5 proteasomal subunits for 72 hours. Depletion of target proteins and effects of reciprocal depletion were determined by immunoblot

