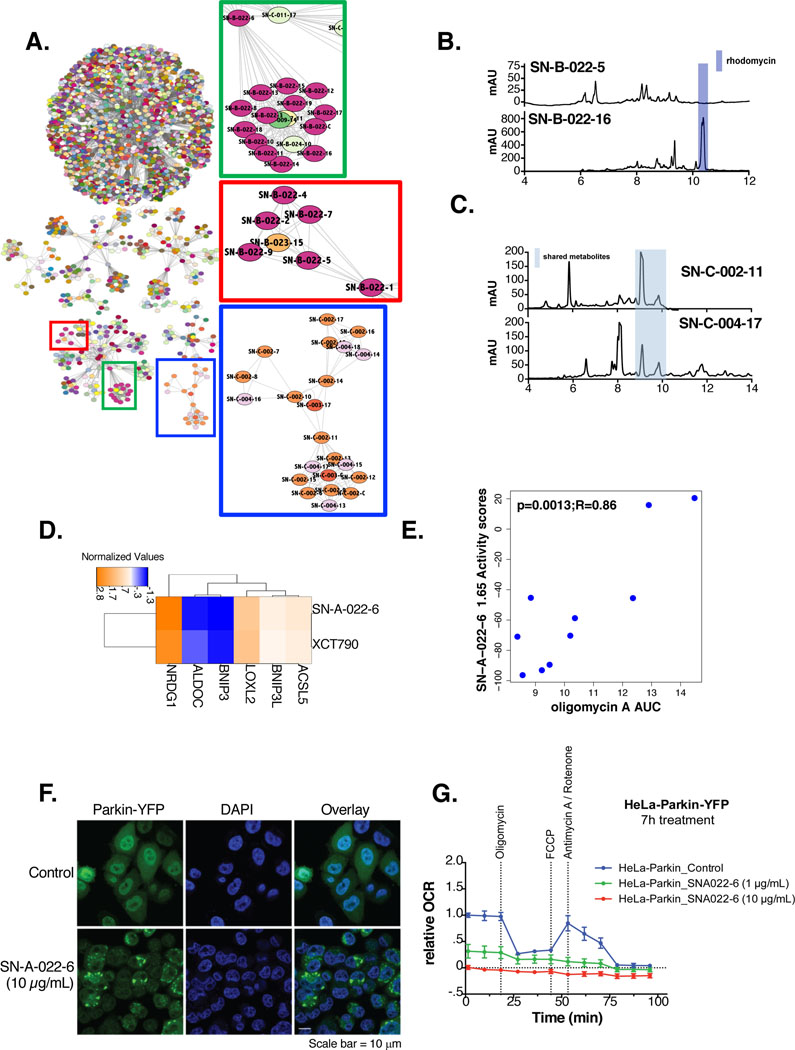
Figure 4: Clustering of NPFs reveals common functions.
(A) AP clustering of the chemical perturbations according to their functional signatures using Euclidean distances as a similarity metric. Nodes are colored according to strain annotations with pure chemicals colored white. Highlighted clusters are zoomed in to the right
(B) LC/MS trace of SN-B-022–5 compared to SN-B-022–16. The peak corresponding to rhodomycin is highlighted in blue
(C) LC/MS trace of SN-C-004–17 compared to SN-C-002–11. The common metabolites in both fractions is highlighted in blue
(D) One-way hierarchical cluster comparing the functional signatures of SN-A-022–6 to XCT-790 (15 μM)
(E) Correlation of viability values in response to SN-A-022–6 (1.65 μg/mL) and AUC in response to oligomycin A in a panel of 10 NSCLC cancer cell lines. Pearson R and p-values are indicated
(F) Fluorescent staining of Parkin-YFP and DAPI (nuclear) for Hela-Parkin YFP cells in response to SN-A-022–6 (10 μg/mL) or compared to no treatment(scale bar=10 μm)
(G) Relative oxygen consumption rates (OCR) of Hela-Parkin YFP cells, normalized to total protein levels, in response to either no treatment (blue), 1 μg/mL (green) or 10 μg/mL (red) of SN-A-022–6 7 hours post-chemical treatment

