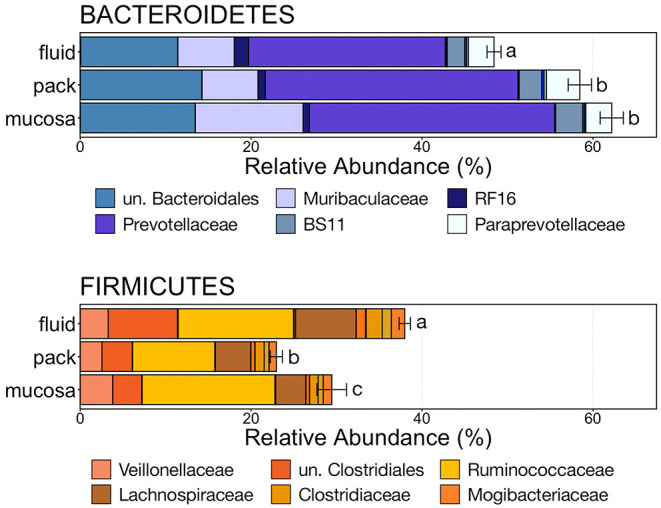
Figure 5.

Bar plot showing the relative abundances of the phyla Bacteroidetes and Firmicutes. Error bars display the standard error of the mean for each phylum and colors represent the relative abundance of families of the two phyla within rumen fluid, pack, and mucosa-associated communities. The top six most abundant families within each phylum are displayed in the legend. Significant differences in the relative abundance of the two phyla are illustrated by different letters (Pairwise Wilcoxon rank-sum with Benjamini-Hochberg correction, p < 0.05, n = 12). un, unclassified.
