
FIGURE 3.
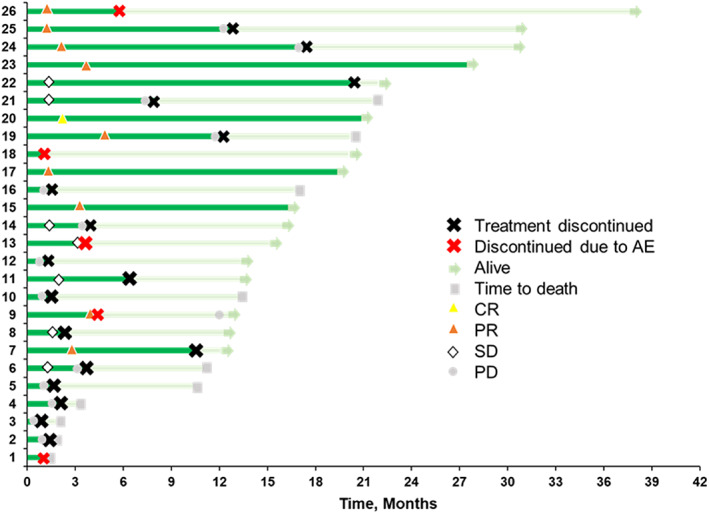
Duration of treatment and time‐to‐response. The bar lengths represent the duration of treatment (dark green) and months of follow‐up (light green). AE, adverse event; CR, complete response; PD, progressive disease; PR, partial response; SD, stable disease