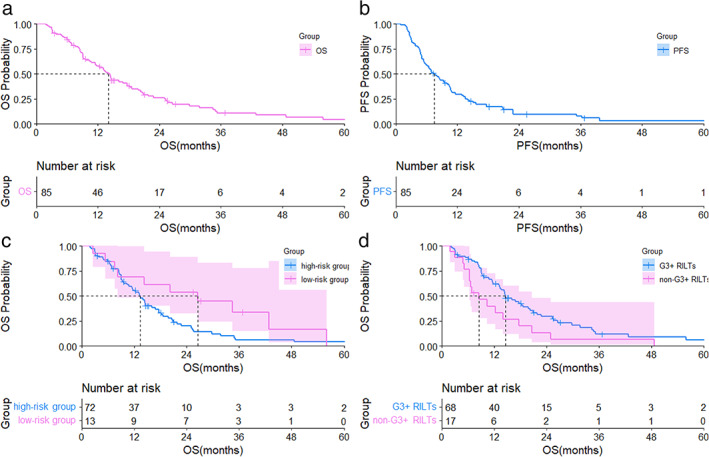
FIGURE 3.

(a) Overall survival curve for patients with stage III NSCLC and ILD treated with TRT; (b) PFS curve for patients with stage III NSCLC and ILD treated with thoracic radiation therapy; (c) overall survival curve for 13 patients in the low‐risk group and 72 patients in the high‐risk group; (d) overall survival curve for 17 patients with G3+ RILTs and 68 patients without G3 RILTs. OS, overall survival; PFS, progression‐free survival; low‐risk group, the patients with V20 <20% and honeycombing score <1; NSCLC, non‐small‐cell lung cancer; ILD, interstitial lung disease; RILTs, radiation‐induced lung toxicities; CI, confidence interval; HR, hazard ratio
