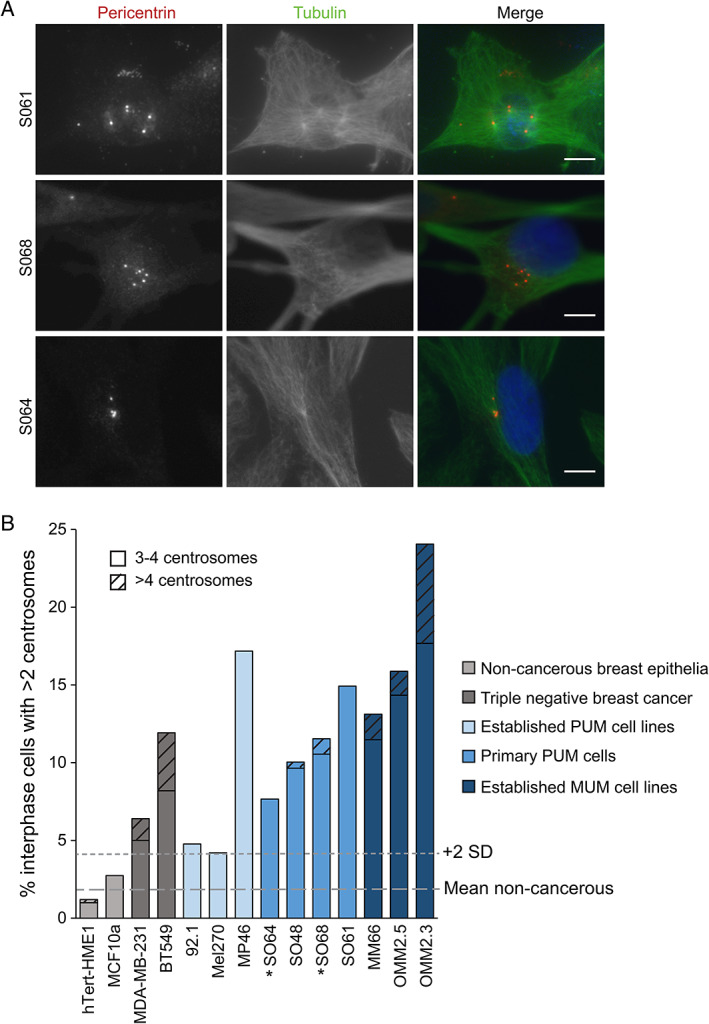
Figure 3.

Interphase UM cell lines and patient‐derived cells exhibit centrosome amplification. (A) Examples of early passage cells derived from patients following enucleation with >2 centrosomes (pericentrin foci). Cells were fixed and stained with pericentrin (centrosome marker), tubulin (microtubules), and DAPI (DNA). Scale bars 10 μm. (B) Established UM cell lines and four patient‐derived PUM cell lines were stained with pericentrin, tubulin, and DAPI to score the percentage of interphase cells displaying more than two centrosomes. Grey lines indicate the mean and mean plus 2 standard deviations of the non‐cancerous cells (hTERT‐HME1 and MCF10A) used to define centrosome amplification. More severe instances of centrosome amplification (>4 centrosomes) are indicated by hatching. Number of interphase cells quantified: hTERT‐HME1: 504, MCF10A: 513, MDA‐MB‐231: 500, BT549: 537, Mel270: 596, 92.1: 42, OMM2.3: 736, OMM2.5: 649, MP46: 99, MM66: 122, SO64: 222, SO48: 249, SO68: 702, SO61: 67. *Monosomy 3 cells.
