
Figure 4.
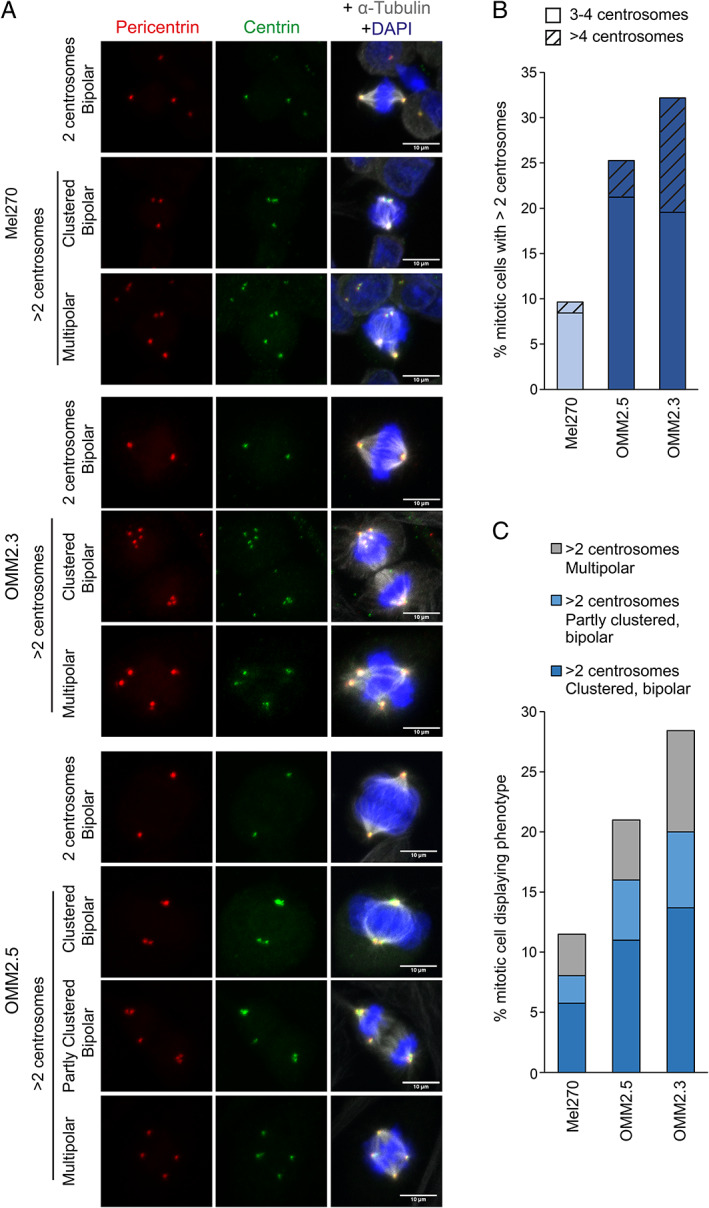
Detailed characterisation of patient‐matched UM cell lines reveals a high level of targetable centrosome amplification in MUM cells. The CA status for three patient‐matched cell lines was characterised in mitotic cells. Mel270 (derived from primary tumour), OMM2.5 and OMM2.3 cells (derived from distinct liver metastases of the Mel270 primary tumour) were fixed and stained with dual centrosome markers, pericentrin (PCM marker) and centrin (centriole marker), as well as alpha‐tubulin and DAPI. Samples were blinded and Z‐stacks covering the full depth of >85 individual mitotic cells for each cell line acquired. (A) Representative maximum‐intensity projections of Z‐stacks, showing observed phenotypes. Scale bars 10 μm. (B) Mitotic cells with >2 centrosomes were quantified. Cells with >4 centrosomes are indicated by hatching. Number of mitotic cells quantified Mel270: 87, OMM2.5: 100, OMM2.3: 95 (C) Mitotic spindle phenotypes of cells displaying centrosome amplification.