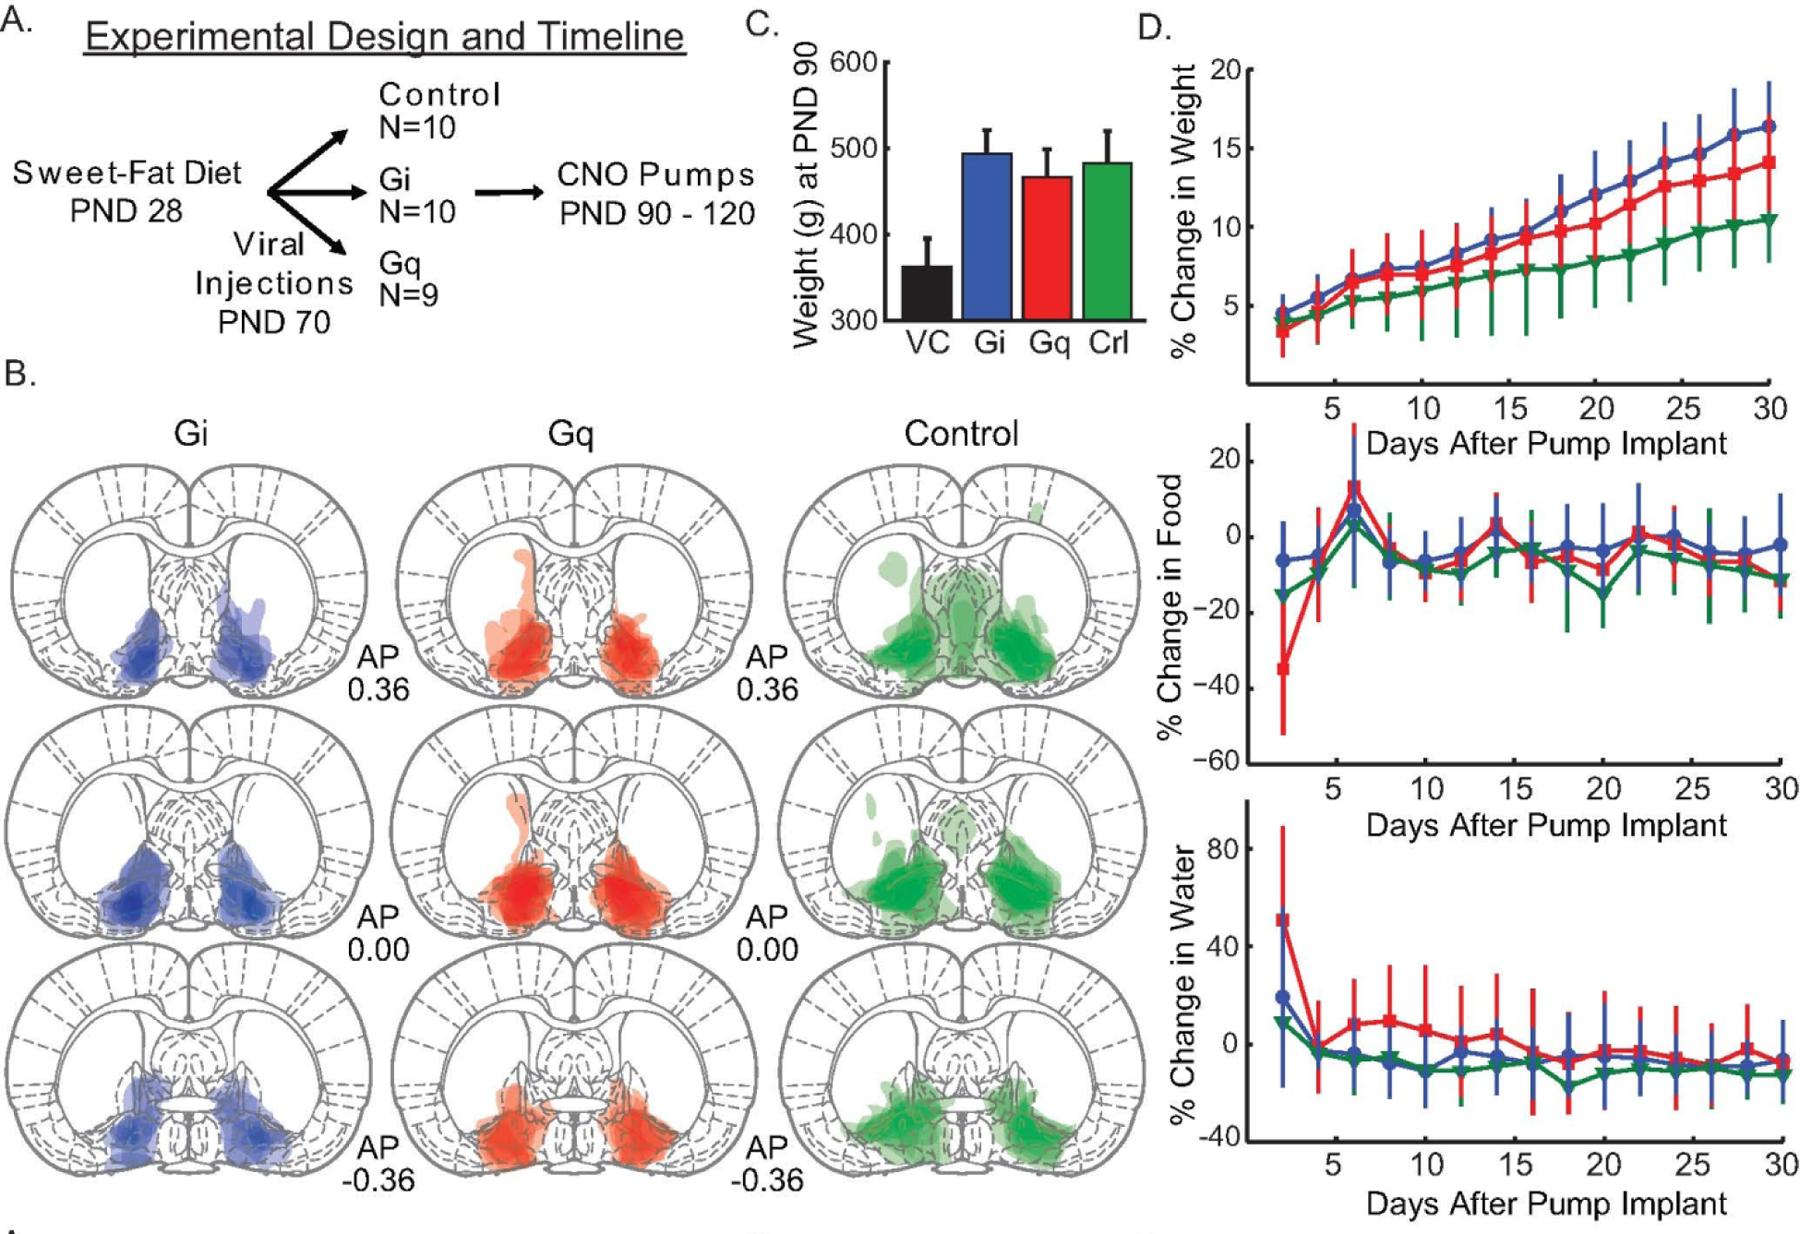
Figure 1. Chronic activation of Gi and Gq in ventral pallidum targeted neurons increases weight gain.

Panel A illustrates the experimental design and timeline. B. The expression of the fluorescent marker mCherry/eYFP for each animal is overlaid in three representative sections along the A-P axis (Bregma: 0.36, 0.00, −0.36) with a separate column and color for each group (Gi - Blue, Gq - Red, control - Green). C. Average weight (grams) of the three cohorts (Gi, Gq, and control [crl]) at postnatal day (PND) 90 ± 1 standard deviation. For comparison the average weight of rats on normal chow at PND 90 from the vendor (VC), Charles River, is shown in black. D. The effect of chronic CNO delivery on weight, food and water consumption is displayed with line color matching that of panel. E. Days are graphed as two-day averages. Error bars = ±1 standard deviation.
