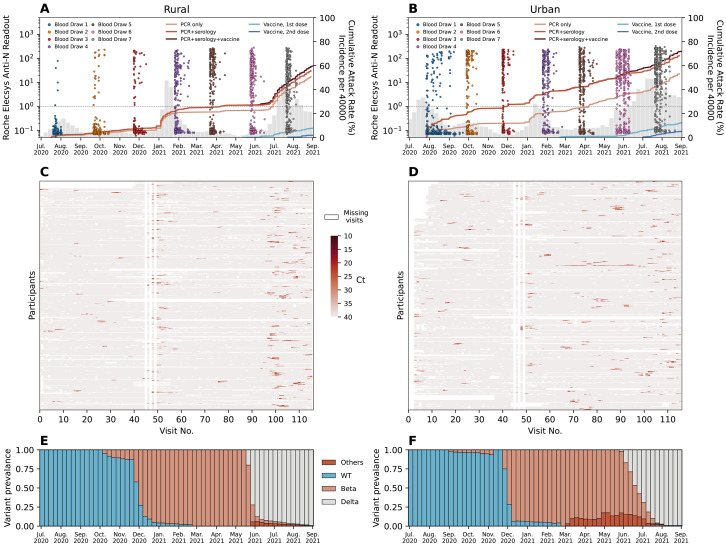
Fig. 1. PHIRST-C study June 2020 – September 2021, description of the epidemiology of SARS-CoV-2 in the two study sites, along with serology and rRT-PCR data.
(A-B) Dots in different colors represent the timing and the readouts (axis on the left) of Roche Elecsys Anti-SARS-CoV-2 assay of serum specimens collected from 4 different blood draws of the rural cohort. The dash line is the positive cutoff of the Roche Elecsys Anti-SARS-CoV-2 assay, above which a specimen is considered sero-positive. The red lines (from light to dark) are the cumulative SARS-CoV-2 variant exposures (axis on the right) over time, captured by positive rRT-PCR of mid-turbinate nasal swab samples only; by either positive serum antibody or positive mid-turbinate nasal swabs by rRT-PCR, and by either positive serum antibody or positive mid-turbinate nasal swabs by rRT-PCR or at least one dose of vaccine. The light and dark blue lines are the cumulative fraction of population receiving a 1st and 2nd dose of vaccine. The grey bars are the weekly SARS-CoV-2 incidence per 40,000 population (sharing the same axis on the right) captured by the surveillance system of Ehlanzeni District in Mpumalanga Province, where the rural site is located. (B) Same as (A) but for the urban site of Klerksdorp in the Dr Kenneth Kaunda District, North West Province. (C-D) rRT-PCR test results for all mid-turbinate nasal specimens collected from individuals in the rural (C) or urban (D) cohort over 80 visits during the 13-month study period. Color white indicates missing specimens; color red indicates the Ct value of the rRT-PCR test, the darker the red color, the lower the Ct value. (E-F) The bi-monthly relative prevalence of D614G mutation, Beta, Delta, and other variants over time at the rural (E) or urban (F) site.

