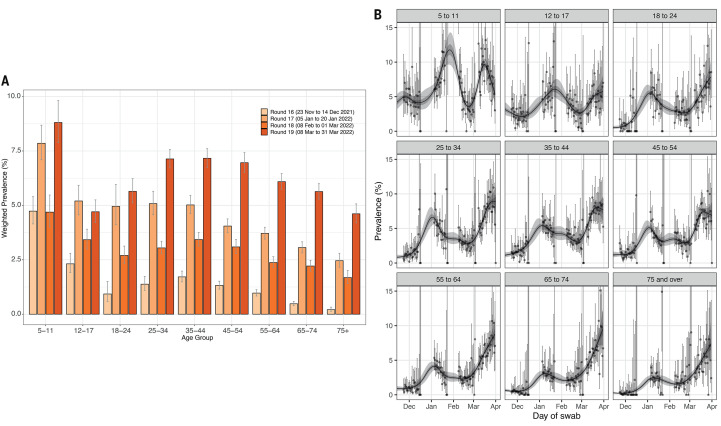
Fig. 2. Weighted prevalence by age.
(A) Weighted prevalence of SARS-CoV-2 swab-positivity by age group from round 16 (light orange) to round 19 (dark orange). Bars show the weighted prevalence point estimates and the vertical lines represent the 95% credible intervals. (B) Comparison of P-spline models fit to SARS-CoV-2 swab-positivity data from all rounds of REACT-1 for those ages 5-11, 12-17, 18-24, 25-34, 35-44, 45-54, 55,64, 65-74, and 75+ years. Shaded regions show 50% (dark shade) and 95% (light shade) posterior credible interval for the P-spline models. Results are presented for each day (X axis) of sampling for rounds 16, 17, 18, and 19, and the prevalence of swab-positivity is shown (Y axis). Weighted observations (dots) and 95% credible intervals (vertical lines) are also shown.

