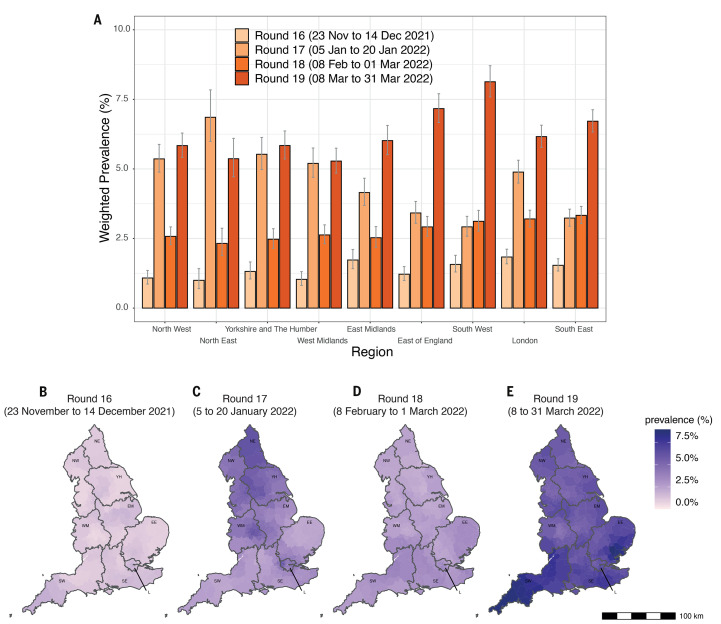
Fig. 3. SARS-CoV-2 swab-positivity by region.
(A) Weighted prevalence of SARS-CoV-2 swab-positivity by region from round 16 (light orange) to round 19 (dark orange). Bars show the weighted prevalence point estimates and the vertical lines represent the 95% credible intervals. (B to E) Neighborhood smoothed average SARS-CoV-2 swab-positivity prevalence by lower-tier local authority area for round 16 (B), round 17 (C), round 18 (D), and round 19 (E). Neighborhood prevalence calculated from nearest neighbors (the median number of neighbors within 30 km in the study). Average neighborhood prevalence displayed for individual lower-tier local authorities for the whole of England. Regions: NE = North East, NW = North West, YH = Yorkshire and The Humber, EM = East Midlands, WM = West Midlands, EE = East of England, L = London, SE = South East, SW = South West.

