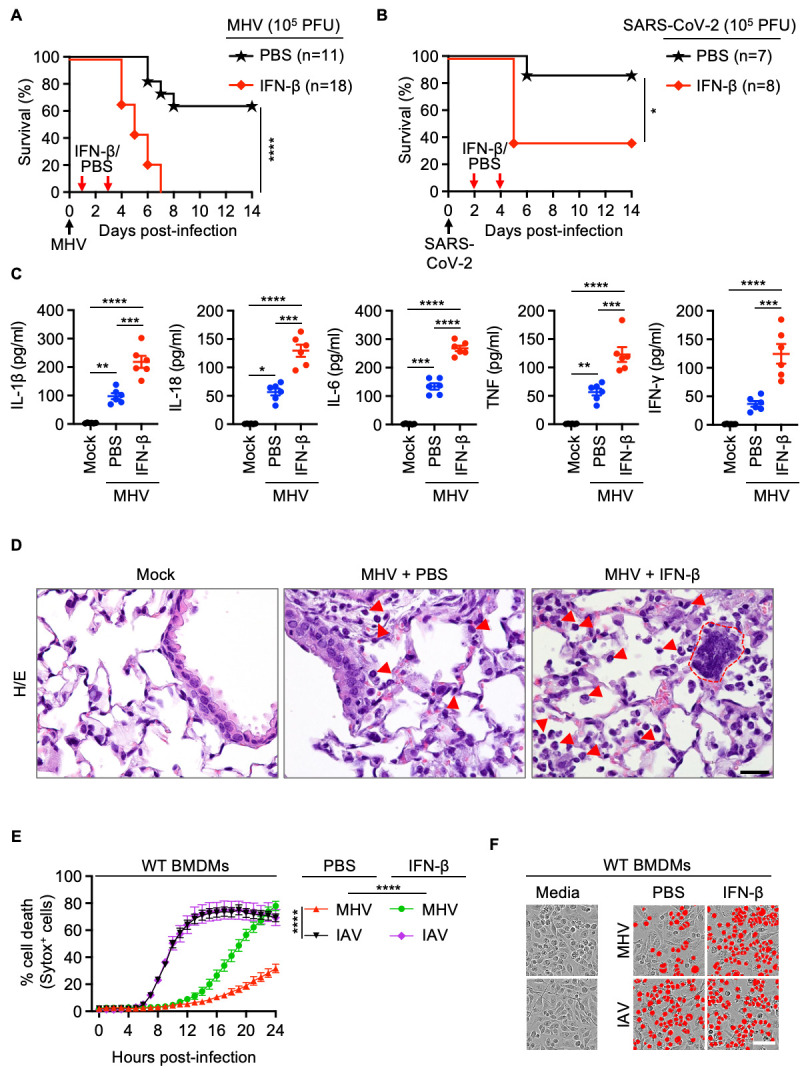
Fig. 2. IFN-β treatment drives lethality, cytokine storm and cell death during β-coronavirus infection.

(A) Survival of 6- to 12-week-old wild type (WT) mice treated with PBS (n = 11) or IFN-β (n = 18) on day 1 and 3 after intranasal infection with mouse hepatitis virus (MHV). (B) Survival of 6- to 12-week-old WT mice treated with PBS (n = 7) or IFN-β (n = 8) on day 2 and 4 after intranasal infection with SARS-CoV-2. (C) Analysis of IL-1β, IL-18, IL-6, TNF and IFN-γ levels in BALF of uninfected WT mice (mock, n = 6) or PBS- (n = 6) or IFN-β– (n = 6) treated WT mice 3 days after MHV infection. (D) Hematoxylin and eosin (H/E) staining of lung samples from WT mice 3 days after MHV infection (PBS- or IFN-β–treated) or no infection (mock). Arrows indicate infiltrating immune cells and dotted red outline represents a syncytial cell. (E) Real-time analysis of cell death in PBS- or IFN-β–treated WT bone marrow-derived macrophages (BMDMs) after infection with MHV or influenza A virus (IAV). (F) Representative images of cell death in PBS- or IFN-β–treated BMDMs are shown at 24 hours after MHV infection or 16 hours after IAV infection. Scale bar, 50 μm (D, F). Data are representative of two (A, C, D) or at least three independent experiments (E, F). *P < 0.05, **P < 0.01, ***P < 0.001 and ****P < 0.0001. Analysis was performed using the one-way ANOVA (C, E) or log-rank test (Mantel-Cox) (A, B). Each symbol represents one mouse (C). Data are shown as mean ± SEM. Images are representative of an experiment containing at least 5 biologically independent samples in each group (D).
