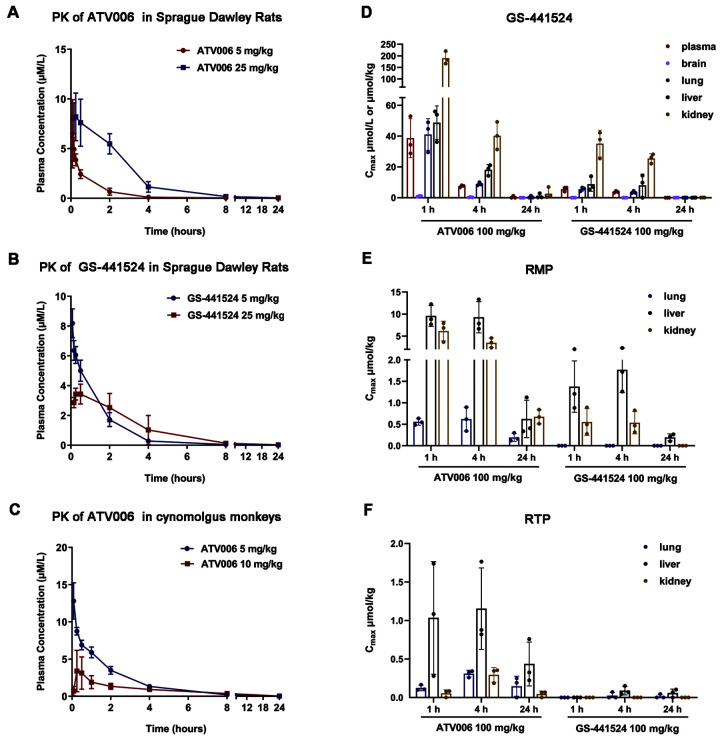
Fig. 3. Pharmacokinetic profile of ATV006 and GS-441524 in Sprague Dawley rats and cynomolgus monkeys.
(A) A time-plasma concentration curve is shown for the nucleoside GS-441524 following a single IV administration of ATV006 (5 mg/kg) or oral administration (25 mg/kg) to Sprague Dawley rats (n = 3, mean ± SD). (B) A time-plasma concentration curve is shown for the nucleoside GS-441524 following a single IV administration of GS-441524 (5 mg/kg) or oral administration (25 mg/kg) to Sprague Dawley rats (n = 3, mean ± SD). (C) A time-plasma concentration curve is shown for the nucleoside GS-441524 following a single IV administration of ATV006 (5 mg/kg) or oral administration (10 mg/kg) to cynomolgus monkeys (n = 3, mean ± SD). (D to F) The tissue distribution of GS-441524 (D), remdesivir nucleotide monophosphate (RMP) (E), and remdesivir nucleotide triphosphate (RTP) (F) is shown for plasma, brain, lung, liver, and kidney after oral administration of 100 mg/kg ATV006 or GS-441524 to Sprague Dawley rats (n = 3, mean ± SD).

