Fig. 5.
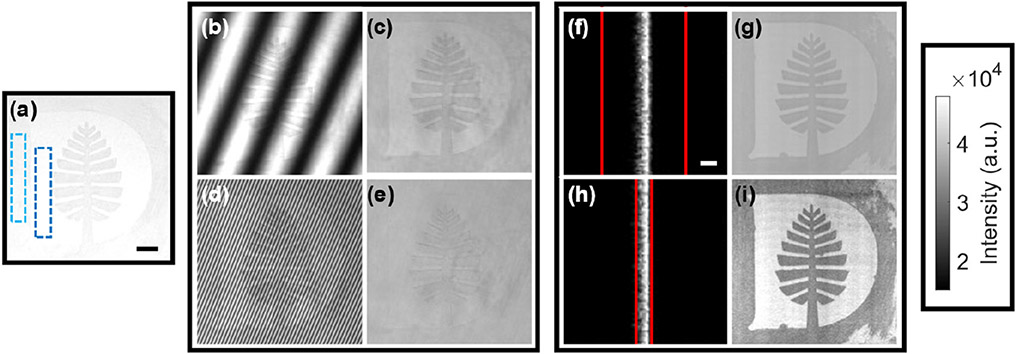
A Dartmouth College Pine logo target demonstrates sensitivity to scattering microtexture. (a) The target under room light with a 1 cm scale bar, showing the construction paper (dark blue) and painted (light blue) regions. (b) SFDI at fx = 0.05 mm−1 yields the demodulated reflectance image in (c). (d) SFDI at fx = 0.61 mm−1 yields the demodulated reflectance image in (e). (f) Close-up of a laser line with δ = 5 mm (red lines) and a 1 mm scale bar and (g) corresponding demodulated reflectance image. (h) Close-up of a laser line with δ = 1 mm and (i) corresponding demodulated reflectance image. All images are shown without histogram stretching.

