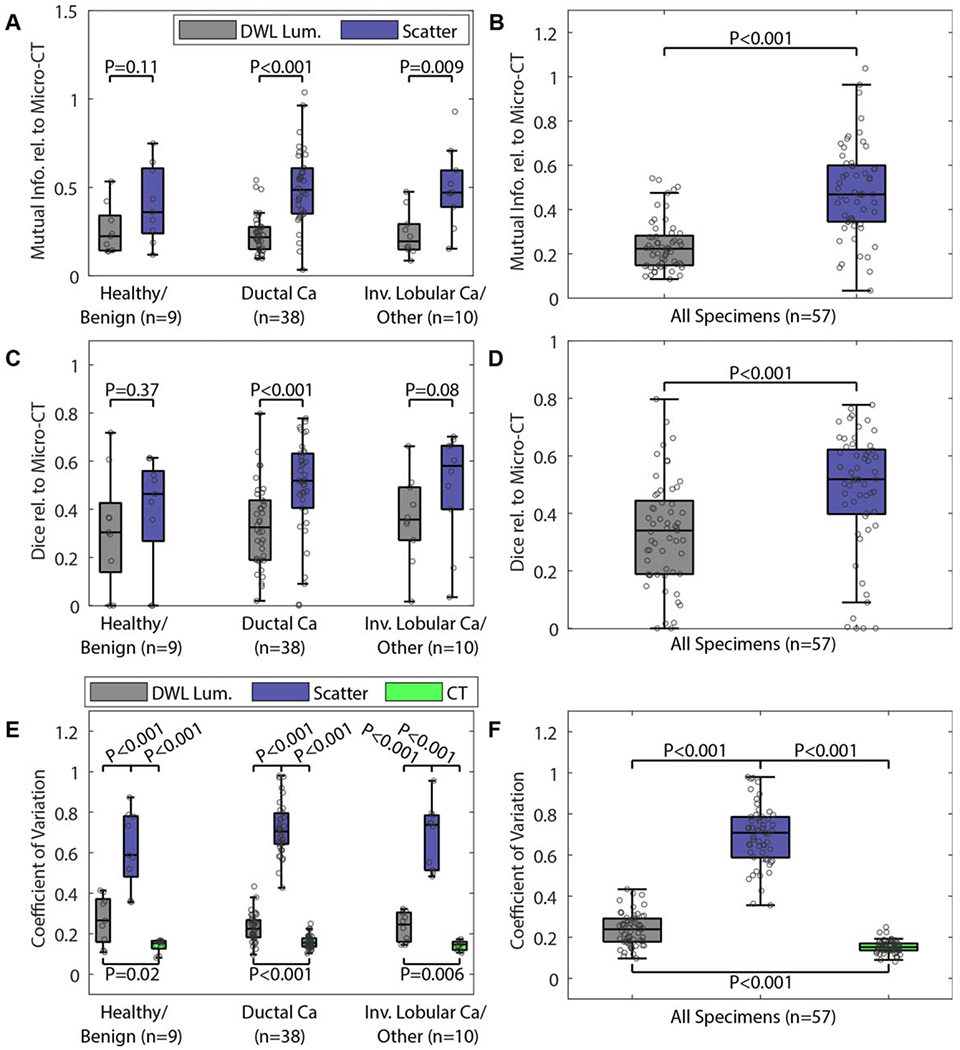
Figure 3.

(A)–(D) Image similarity metrics quantified between micro-CT and either diffuse white light luminance or optical scatter images. (E) and (F) The coefficient of variation quantified for each image type. The legend in (A) applies to all subplots in (A)–(D). The legend in (E) also applies to (F). DWL Lum. = white light diffuse luminance; scatter = 490 nm optical scatter; CT = micro-CT; Ca = carcinoma; other = metaplastic tumor.
