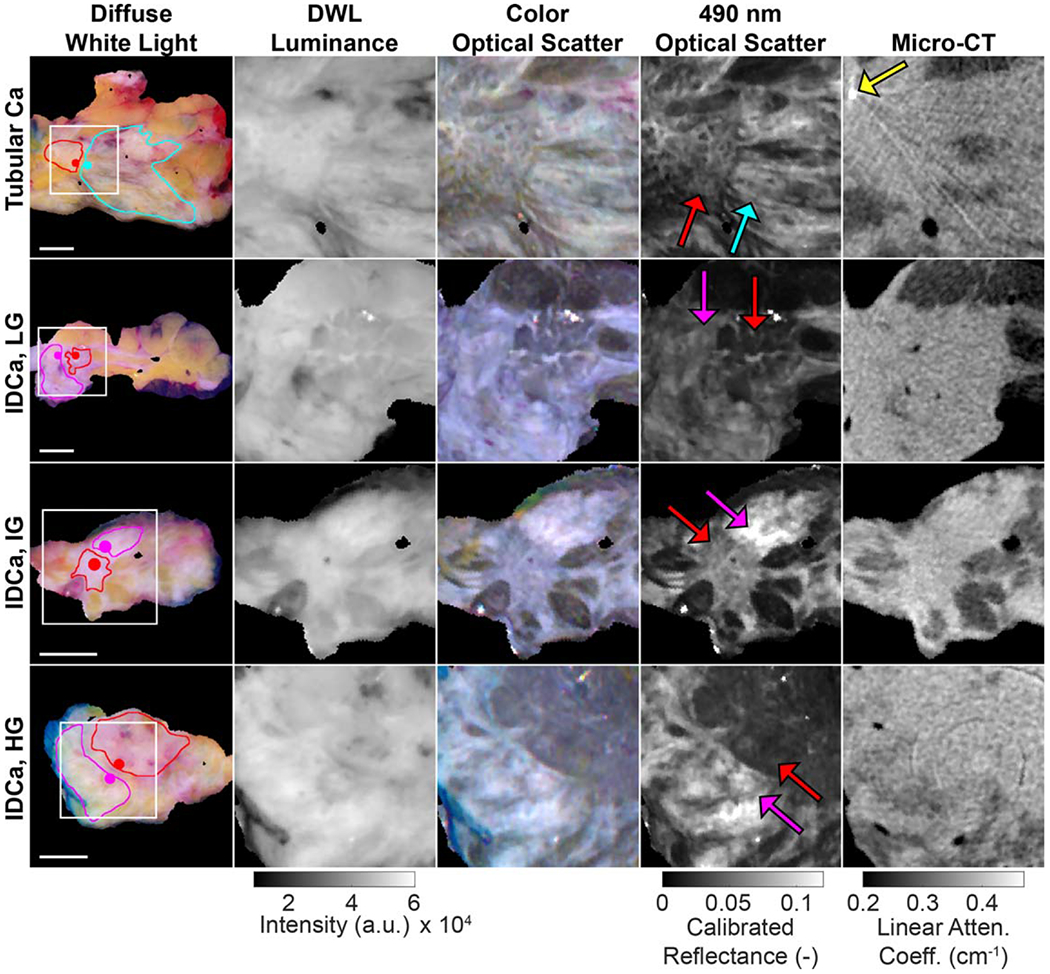
Figure 5.

Representative tumor slices exhibiting malignant tissue boundaries (red lines/arrows) with adjacent non-malignant fibrous tissue (pink lines/arrows = healthy connective tissue; cyan line/arrow = fibrocystic disease). Regions of interest (white squares, 2 cm × 2 cm, column 1) magnify malignant tissue boundaries in the following four columns. A beam hardening artifact from a surgical clip is seen in the top row micro-CT (yellow arrow), and a ring artifact is present in the bottom micro-CT. 1 cm scale bars are shown for each row. Linear attenuation coefficient values correspond to 50 kVp. DWL = diffuse white light; Ca = carcinoma; IDCa, LG = invasive ductal carcinoma, low grade; IDCa, IG = invasive ductal carcinoma, intermediate grade; IDCa, IG = invasive ductal carcinoma, high grade.
