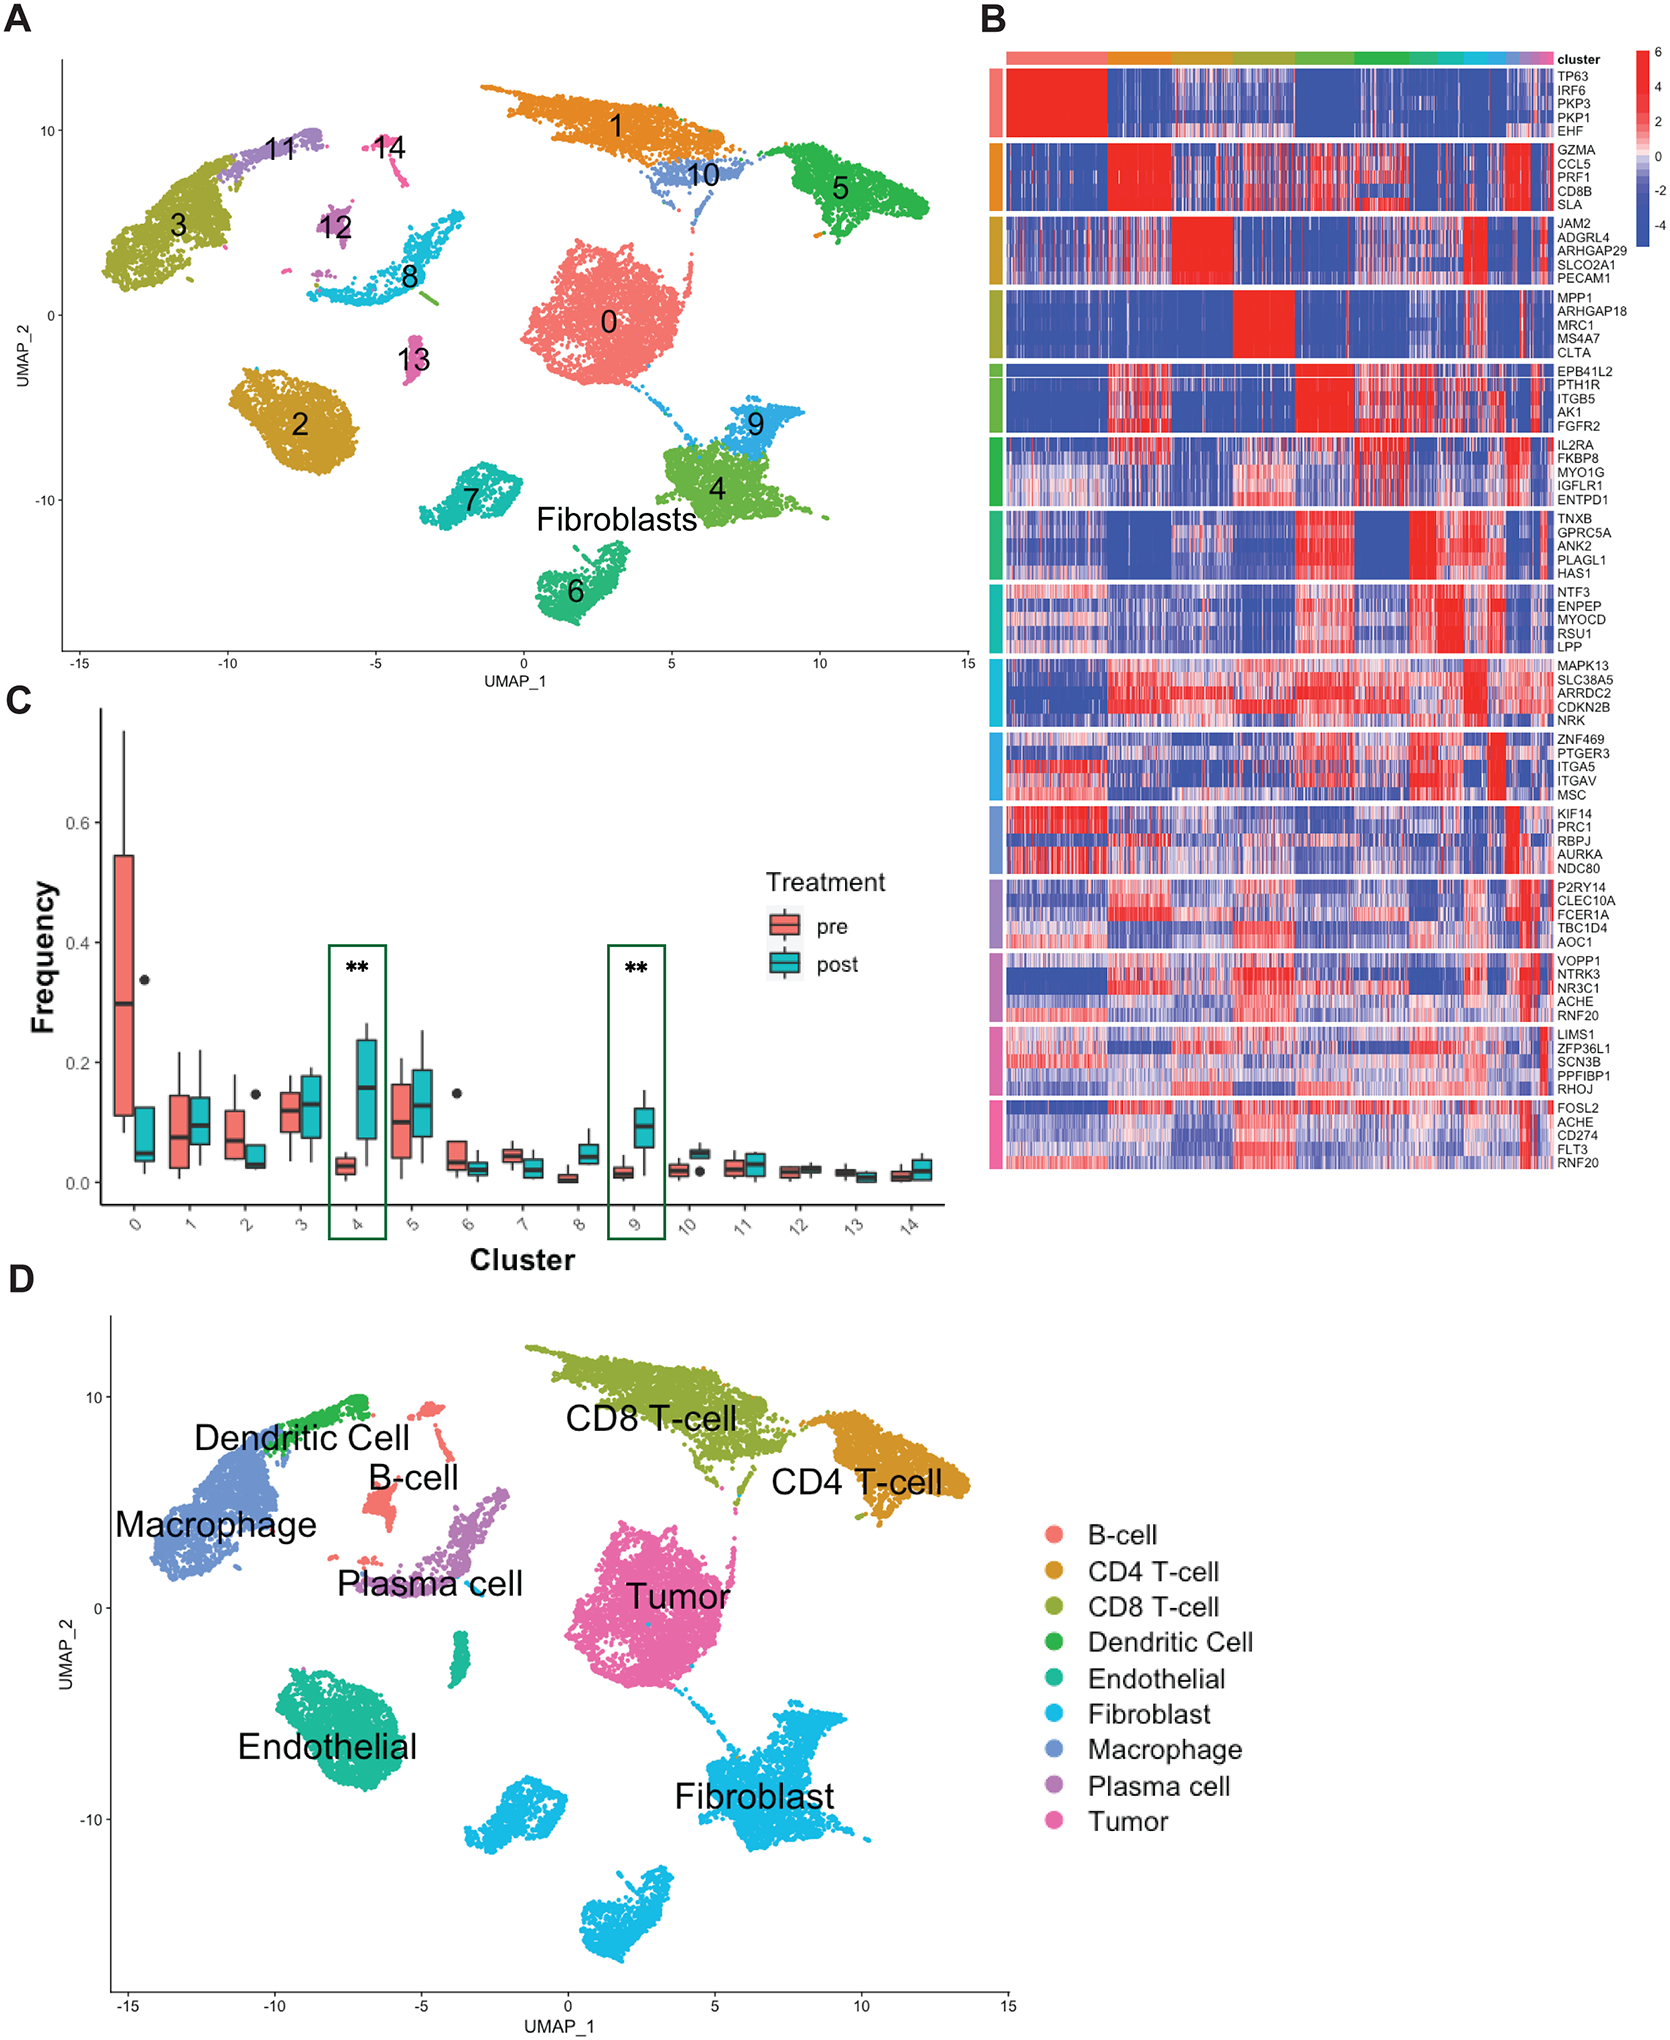
Figure 1. VIPER analysis of longitudinal single-cell transcriptomic profiles of HNSCC show CAF changes associated with immunotherapy.

A) 2-dimensional UMAP projection of cells across all samples (n=4), processed by VIPER and clustered by resolution-optimized Louvain. Cells are colored by unsupervised cluster number, with fibroblast clusters (4,6,7,9) further labelled by cell type. B) Heatmap of top 5 most differentially upregulated proteins per cluster for each cell population in A. C) Boxplot of population frequency at baseline and following ⍺PD-1 immunotherapy for each cell type cluster in A. CAF subtypes increasing in response to immunotherapy are emphasized with green outline, ** indicates p<0.01. D) SingleR cell type inference projected on UMAP plot. Each cluster is assigned a lineage cell type based on its majority SingleR-inferred label.
