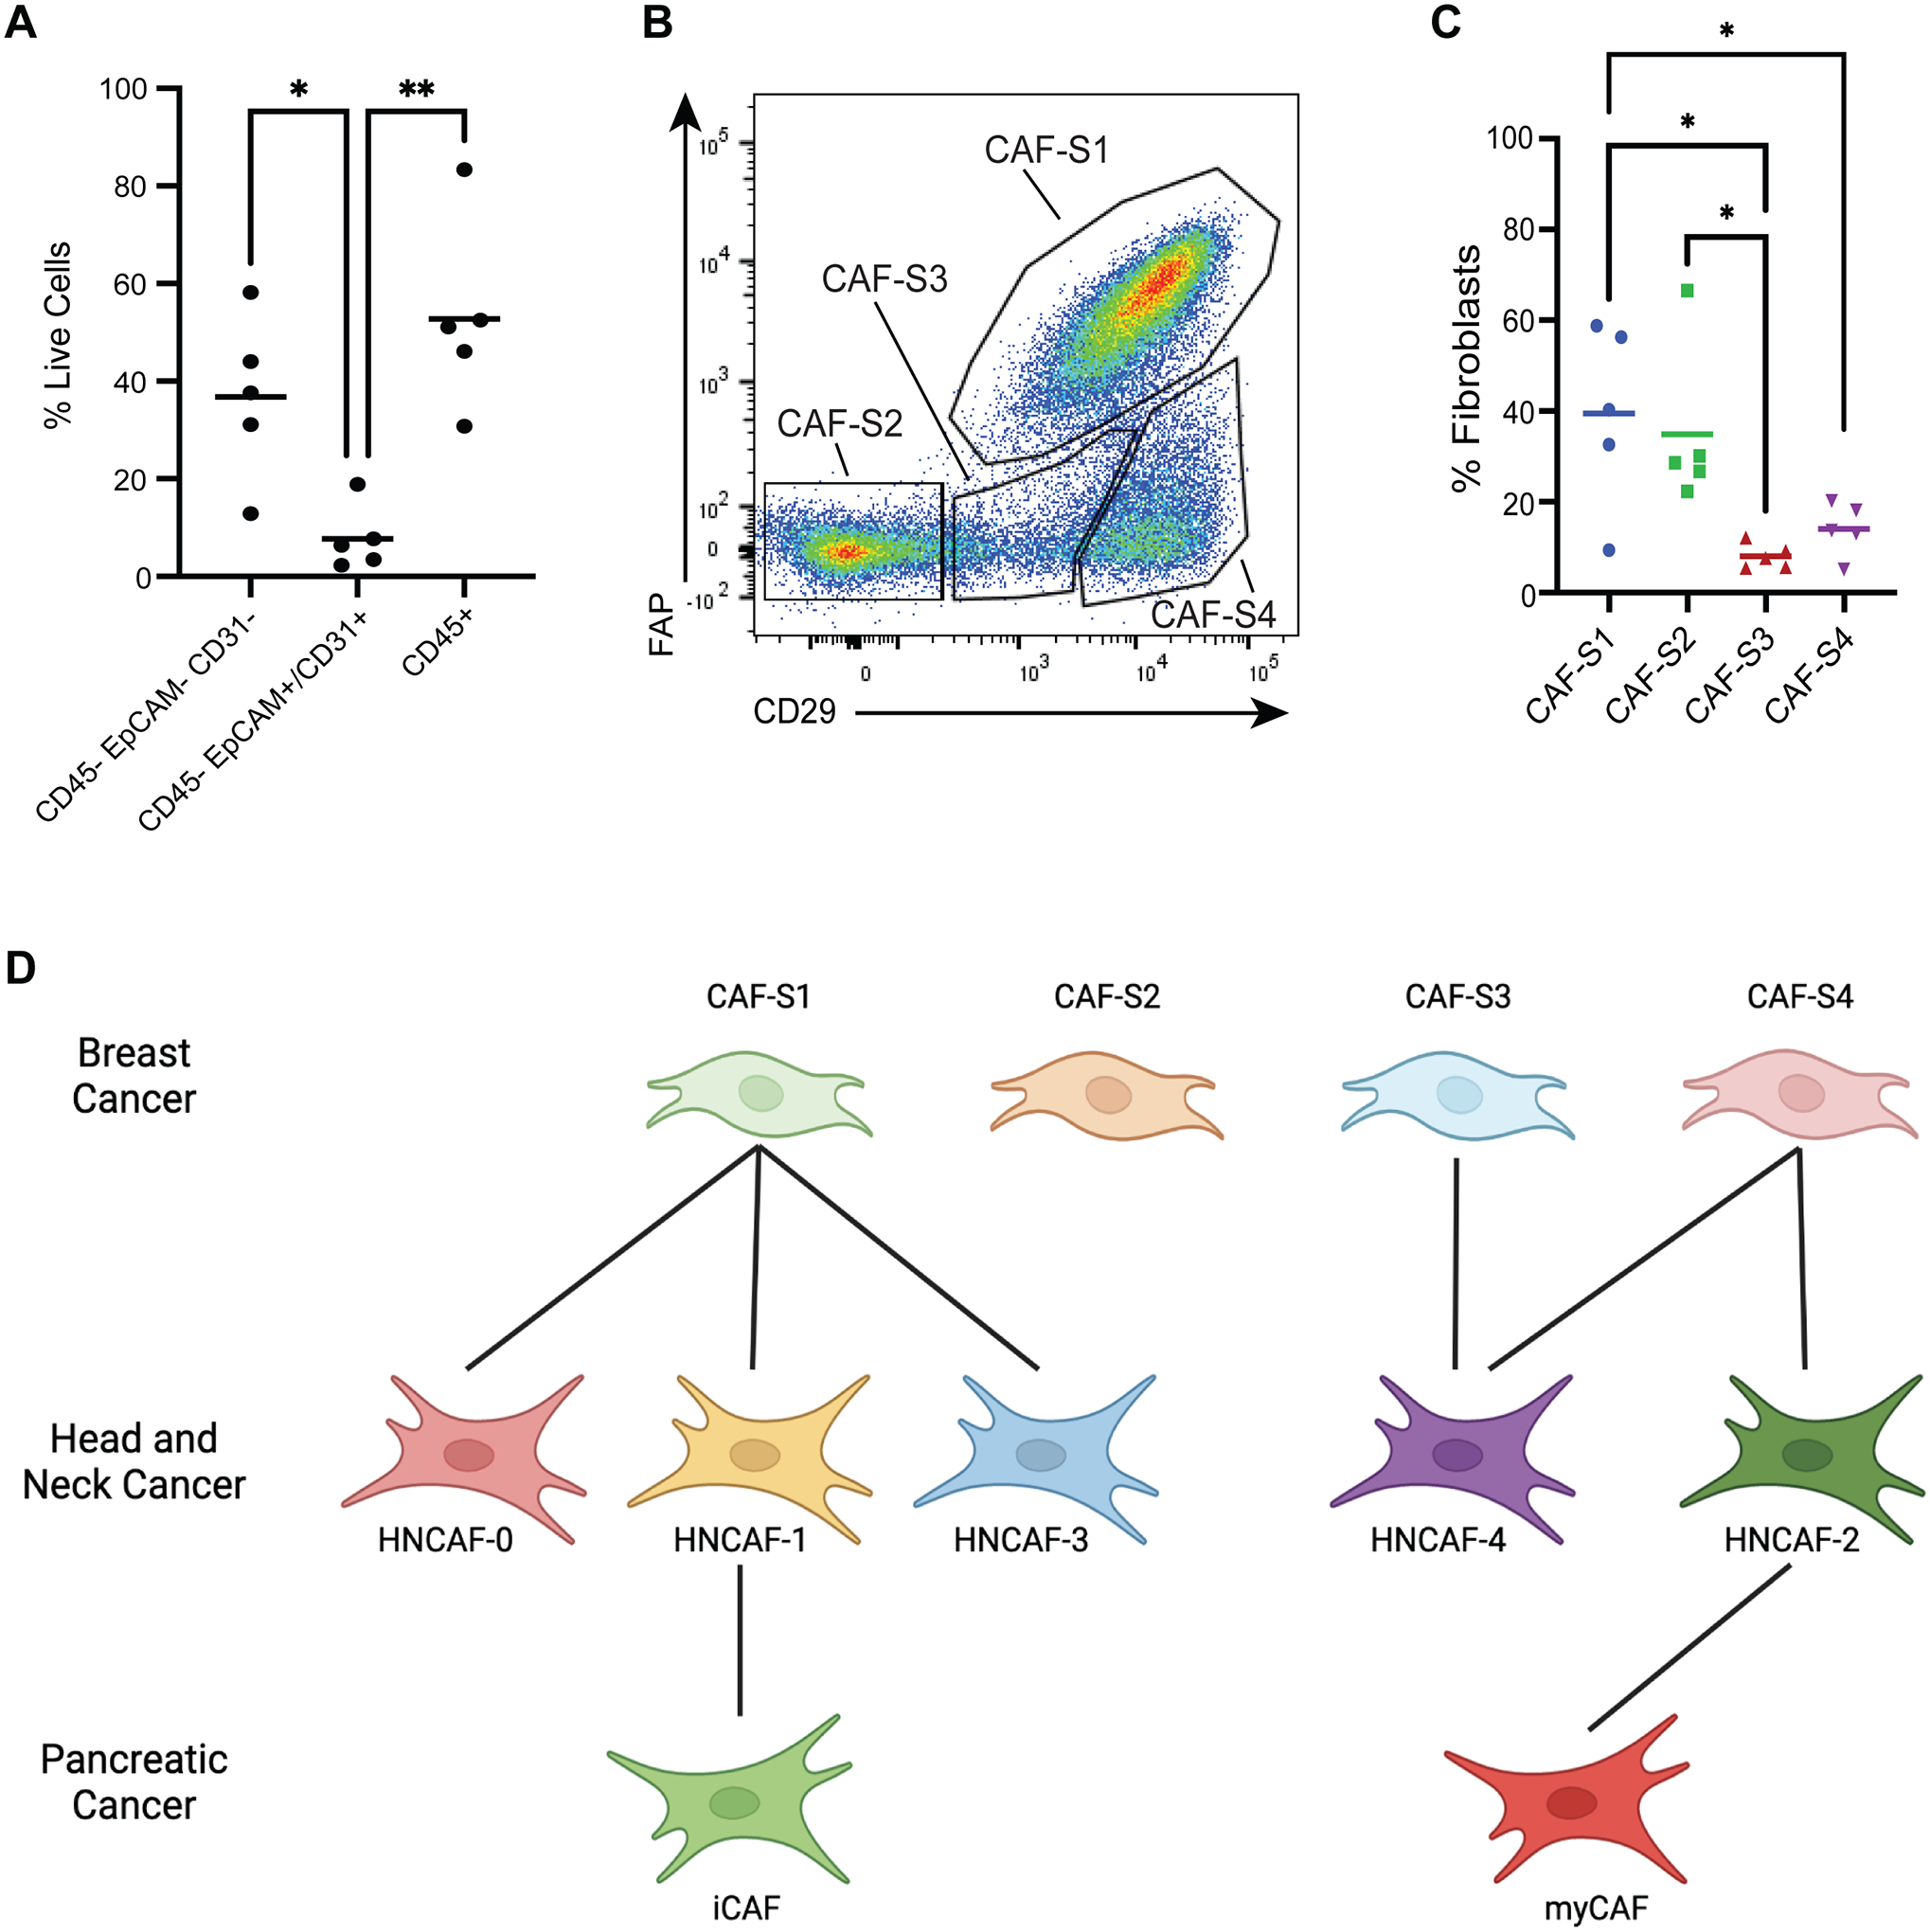
Figure 3. Prognostically associated HNCAF sub-populations provide greater resolution than previously characterized CAF phenotypes.

A) Relative frequencies of stromal (CD45-Epcam-CD31-), epithelial/endothelial (CD45-Epcam+/CD31+) and immune (CD45+) cell components across HNSCC patients quantified by flow cytometry (n=5). B) Flow cytometry gating strategy to isolate previously described CAF phenotypes from HNSCC specimens. C) Relative frequency for each CAF subtype from B among total CAF quantified by flow cytometry (n=5). D) Phenotype-matching between unsupervised HNCAF clusters from scRNA-Seq and previously defined CAF-S1 to CAF-S4, as well as iCAF and myCAF. Each single-cell HNCAF population is labelled as the sorted CAF-S1 to CAF-S4 population with highest gene set enrichment, as shown in Figure S3. The data in A and C were analyzed using one-way ANOVA and * indicates p<0.05, ** indicates p<0.01.
