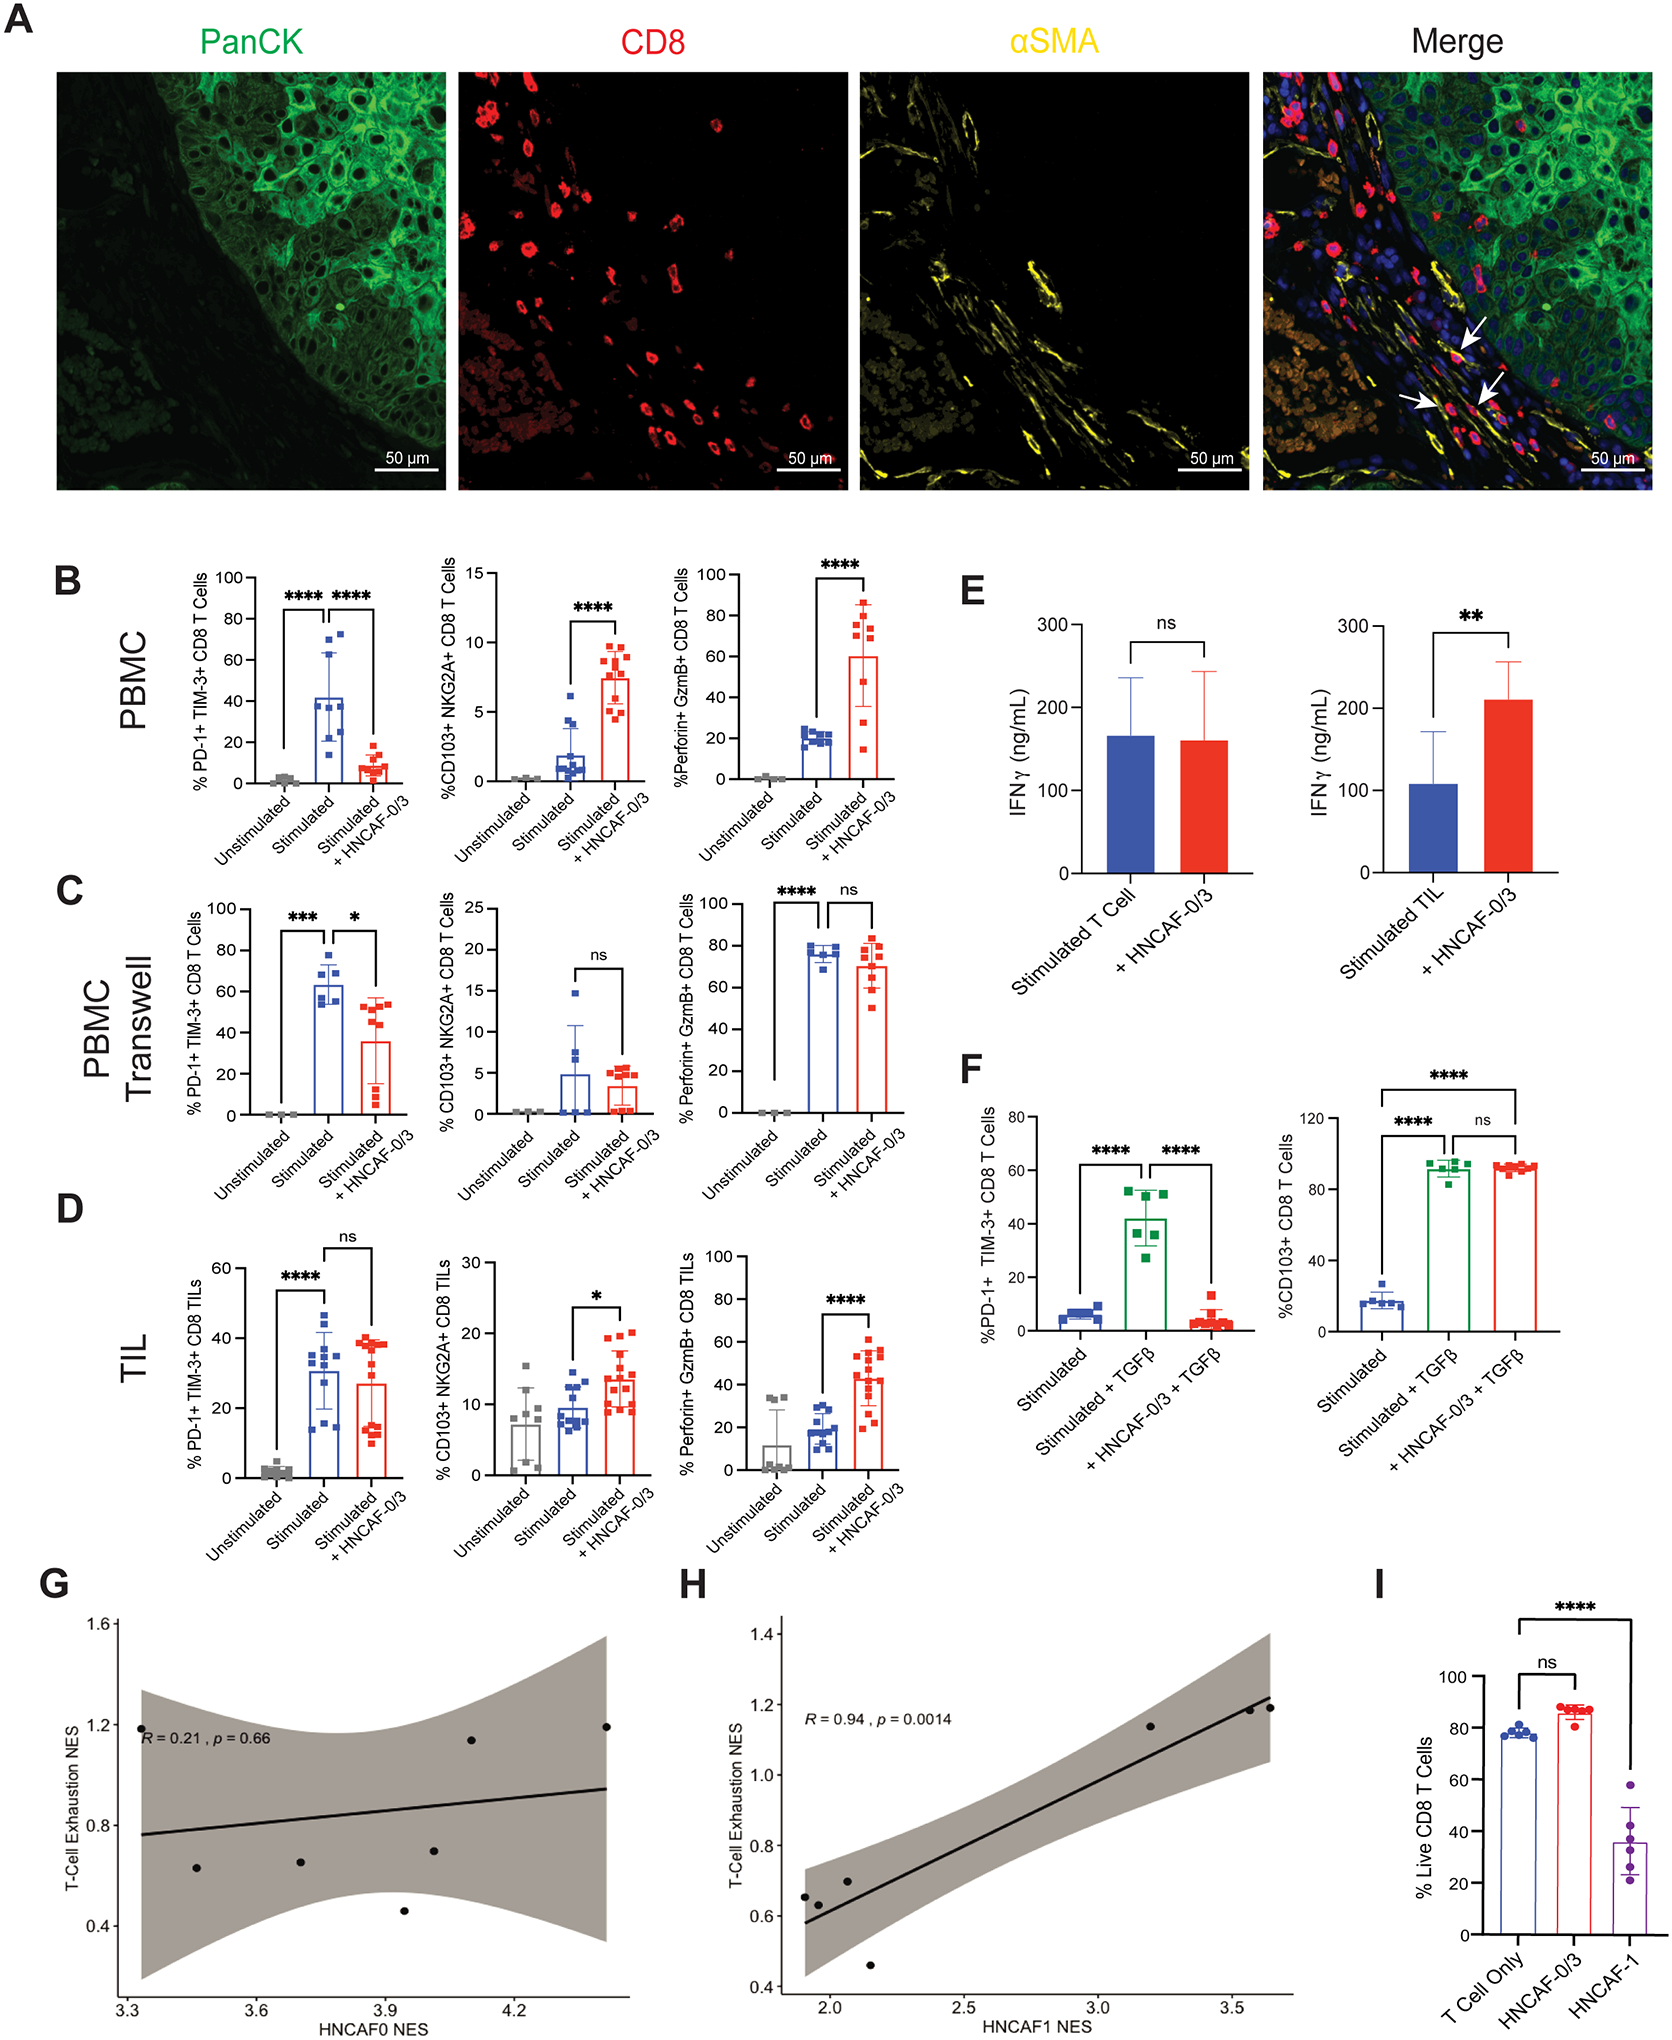
Figure 5: HNCAF spatially co-localizes with CD8 T cells and HNCAF-0/3 functionally decrease TGFb dependent T cell exhaustion in vitro.

A) Pre-treatment DSP immunofluorescence imaging from a representative patient treated with ⍺PD-1 immunotherapy, such that tumor cell localization is indicated by panCK staining (green), Cytotoxic T cell localization by CD8 staining (red), fibroblast localization by ⍺SMA staining (yellow), and nucleated cells by DAPI staining (blue). Arrows indicate interactions between ⍺SMA+ fibroblasts and CD8+ T cells. B) Co-culture experiment of naïve T cells derived from peripheral blood mononuclear cells (PBMC) with CD3/CD28 stimulation and isolated HNCAF-0/3 cells, showing T cell exhaustion markers (%PD-1+ TIM-3+ cells), tissue residency memory markers (%CD103+ NKG2A+ cells), and cytotoxicity (%Perforin+ GzmB+ cells) (n=3–12). C) Co-culture experiment of T cells with HNCAF-0/3 cells as in B except in contact-isolating transwell culture (n=3–9). D) Co-culture experiment of Tumor-Infiltrating Lymphocytes (TIL) with CD3/CD28 stimulation and isolated HNCAF-0/3 cells (n=9–15). E) Interferon gamma levels in co-culture of naïve T cells derived from PBMC and TIL with HNCAF-0/3 cells determined by ELISA (n=3 for PBMCs; n=6 for TIL). F) Rescue experiment of T cells derived from PBMCs with CD3/CD28 stimulation and TGFβ with or without HNCAF-0/3 (n=6–9). G) Spatial enrichment of HNCAF-0/3 gene set vs enrichment of T-cell exhaustion signature in Nanostring DSP of tissue slices across patients (n=2). H) Spatial enrichment of HNCAF-1 gene set vs enrichment of T-cell exhaustion signature in Nanostring DSP of tissue slices across patients (n=2). Signatures are positively correlated with respect to spatial co-localization (correlation coefficient=0.94, p=0.0014). I) Quantitation of live cells out of total CD8 T cells determined by flow cytometry from co-culture with HNCAF-0/3 or HNCAF-1. B-D, F) Percentages were quantified by flow cytometry. Results are shown as mean ± SD and are representative of at least three independent experiments. The data were analyzed using one-way ANOVA (B-D, F, I) or the Student t test (E) and * indicates p<0.05, ** indicates p<0.01, *** indicates p<0.001, and **** indicates p<0.0001.
