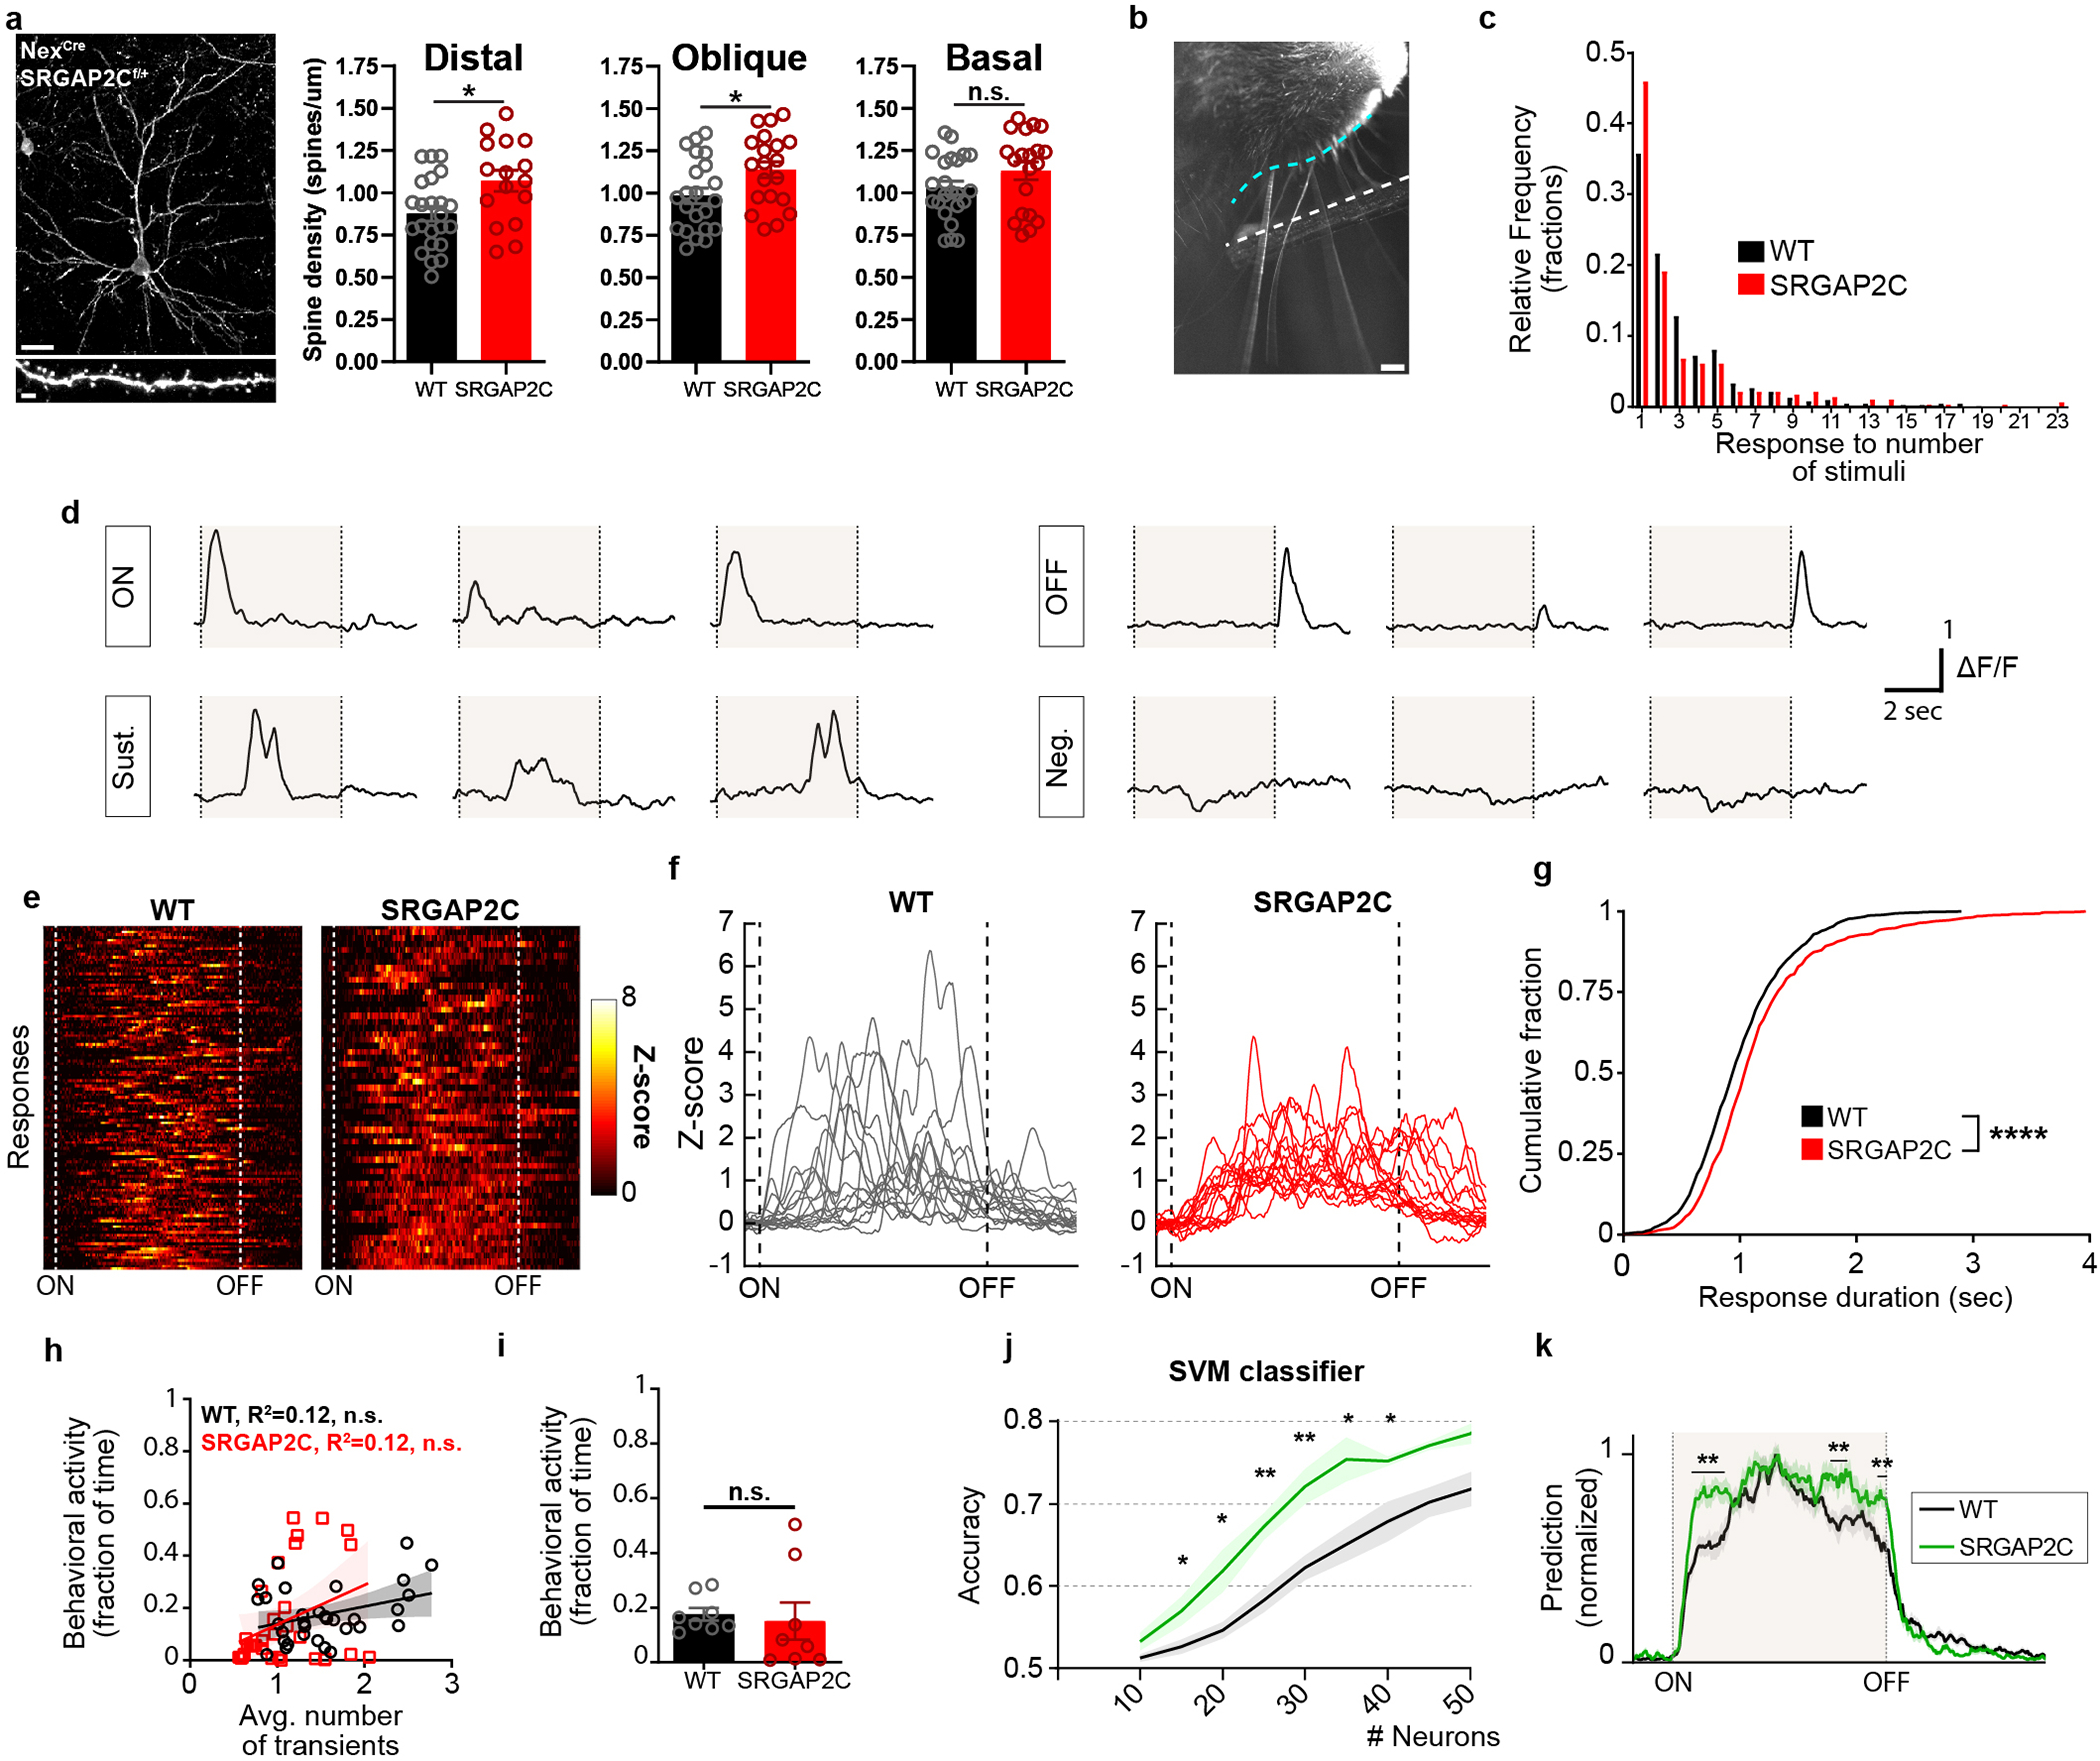
Extended Data Figure 7. Neuronal responses following whisker stimulation.

(a) Left: Coronal section stained for HA showing sparse labeling of a layer 2/3 cortical pyramidal neuron in the barrel field of the primary somatosensory cortex with high magnification (bottom) of dendritic segment in which spines can clearly be identified. Scale bar top, 25 μm. Scale bar bottom, 2 μm. Right: Spine density quantification in SRGAP2C heterozygous conditional knock-in mice crossed with heterozygous NexCre/+ mice. Spine density is increased for distal and apical but not basal dendritic segments (P = 1.34 × 10⁻² for distal, P = 2.47 × 10⁻² for apical oblique, P = 0.117 for basal; distal: n = 23 segments for WT and n = 16 for SRGAP2C, apical oblique: n = 22 segments for WT and n = 20 segments for SRGAP2C, basal: n = 23 segments for WT and n = 20 segments for SRGAP2C). Bar graph plotted as mean ± s.e.m. *P < 0.05, two-sided Mann-Whitney test. (b) Top-down view of placement of stimulating rod (white dashed line, 2mm away from the whisker pad) next to right whisker pad (cyan dashed line). Scale bar, 1mm. (c) Frequency distribution of response fraction for neurons responding to either onset, sustained phase, or offset of the stimulus. (d) Singe-trial example responses. Shaded area indicates whisker stimulation. (e) Ten percent of single trial Sustained responses with longest sustained activity converted to Z-scores and sorted by duration of response. ON and OFF dashed lines indicate stimulus onset and offset, respectively (f) Bottom 15 responses shown in (e). (g) Cumulative probability distribution of Sustained response durations (time that Z-score was greater than 1). P < 1 × 10⁻⁴, Kolmogorov-Smirnov test. (h) Correlation between behavioral activity and average number of transients (n = 32 runs for 8 FOVs from 4 WT mice and n = 32 runs for 8 FOVs from 3 SRGAP2C mice). (i) Fraction of time during which behavioral activity was observed (n = 8 FOVs from 4 WT and n = 8 FOVs from 3 SRGAP2C mice). Bar graph plotted as mean ± s.e.m., two-sided Mann-Whitney test. (j) Support vector machine (SVM) accuracy in classifying presence or absence of whisker stimulus. Shaded area indicates s.e.m. (k) Normalized SVM prediction accuracy across time from stimulus ON to stimulus OFF for 25 neurons per field of view. Shaded area indicates stimulus time. Multiple t-test with multiple comparison correction using false-discovery rate Benjamini-Hochberg method (q < 0.05), *P < 0.05, **P < 0.01.
