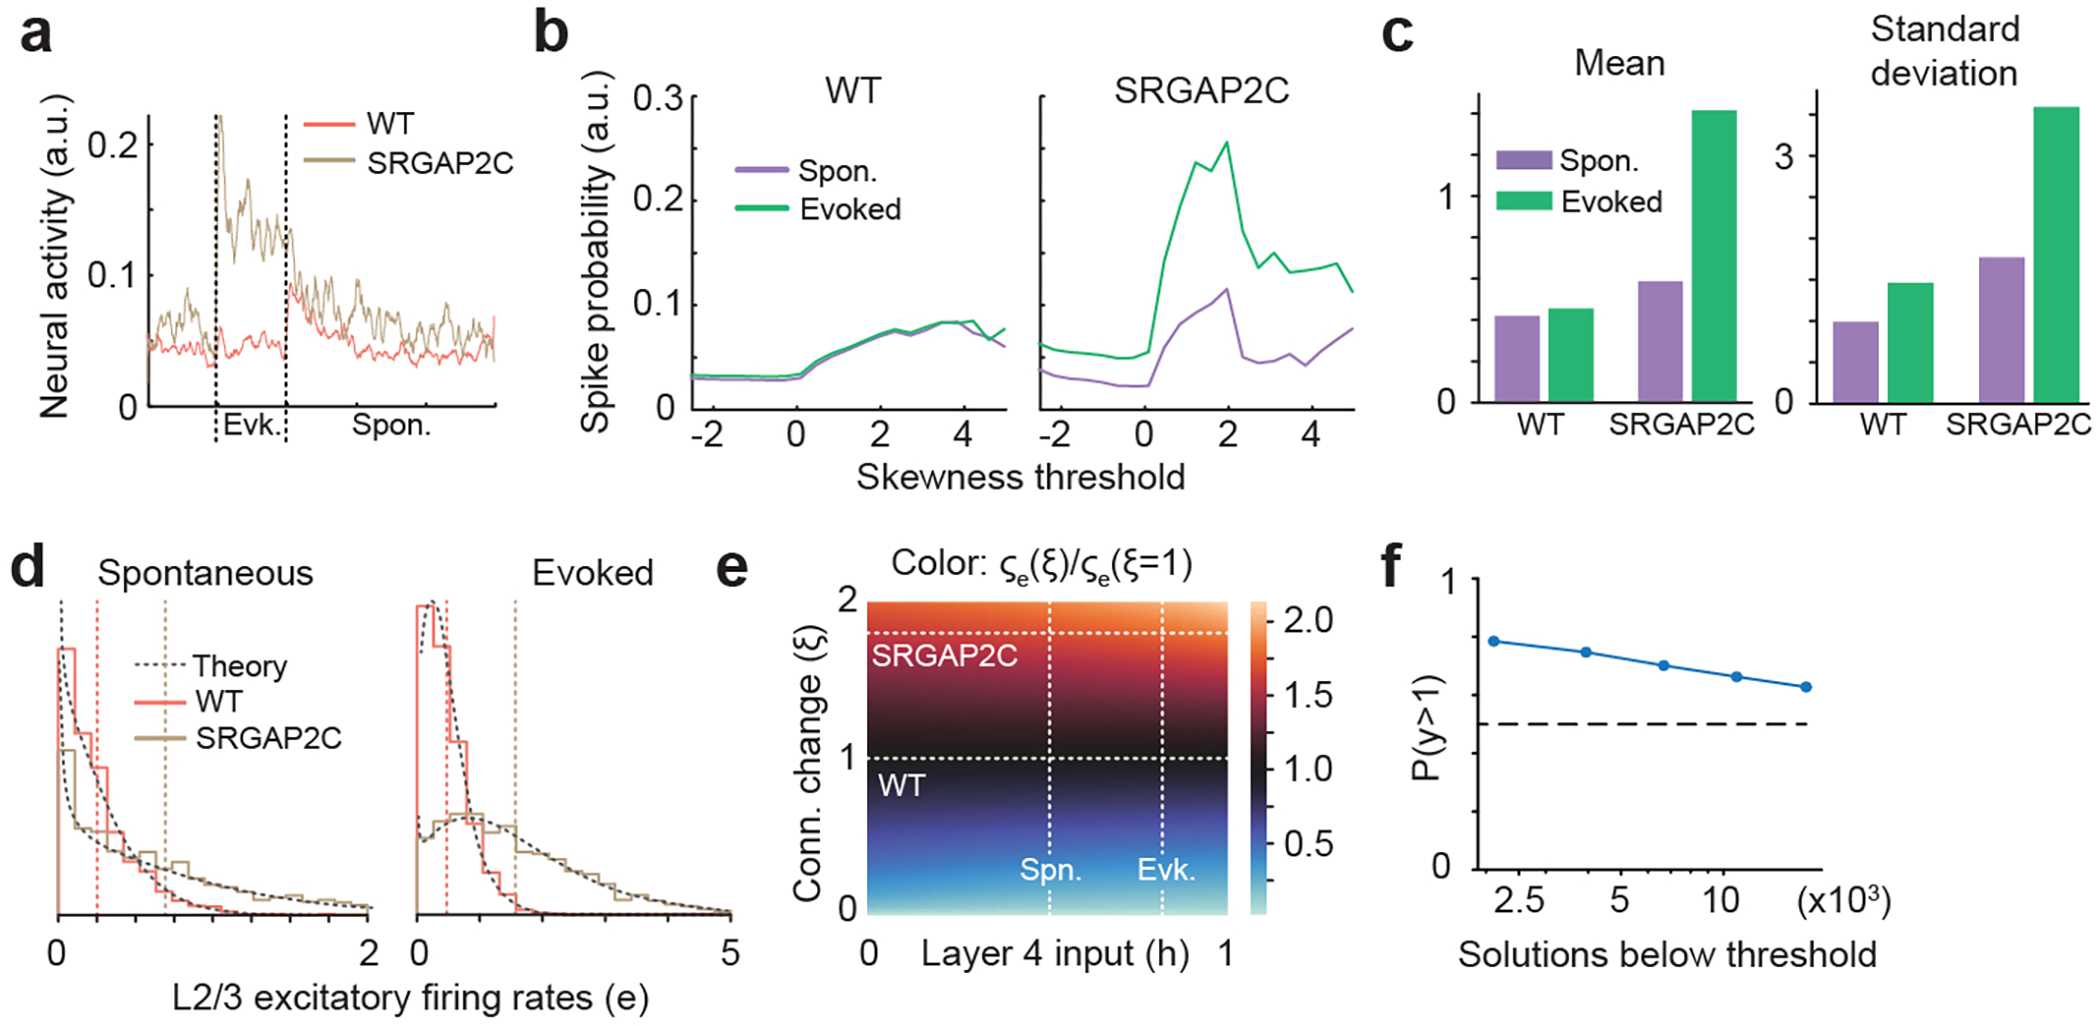
Extended Data Figure 9. Modeling of layer 2/3 PN response properties in WT and SRGAP2C mice.

(a) Population stimulus-triggered-average neural activity obtained by averaging over all neurons in Extended Data Figure 8b. Vertical dashed lines correspond to stimulus onset and offset. (b) Average neural activity computed during the 5 s before the stimulus (Spon.) or during the 5 s of stimulation (evoked; stimulus is applied at time 0) across all selected neurons and trials as a function of the skewness threshold used to select neurons. The threshold in (a) is 1.5. (c) Mean and standard deviation of the deconvolved traces in Extended Data Figure 8b during both stimulus conditions. (d) The normalized distributions of simulated excitatory rates in both SRGAP2C (brown) and WT (red) mice and during spontaneous and evoked mean input illustrate the increase in the mean and variance discussed in the main text. The shapes of the distributions agree with their mathematical approximations (dashed black line) discussed in Supplementary Material. (e) The ratio of the standard deviation of excitatory rates between mice with an arbitrary change in connection strength and WT mice. This demonstrates that the effects are robust to the specific choice of parameters. (f) Probability of solutions with y>1 as a function of the number of solutions with a fit error of the firing rates of the wild type mouse below a certain threshold, where y = [mu(2c,evoked)/mu(2c,spont)]/[mu(wt,evoked)/mu(wt,spont)] and mu corresponds to the mean firing rate of the excitatory population.
